by Eldric Vero
April 10, 2024
This CotD was inspired by two recent articles:
1) The Globe and Mail “More people than expected are dying in Canada in 2023 for reasons that are not yet clear ” (see link: https://www.theglobeandmail.com/canada/article-excess-deaths-covid-canada/ ). From the article: Kim McGrail, a professor at the University of British Columbia’s Centre for Health Services and Policy Research, said she thinks of excess mortality as “an indication that there’s something happening that’s worth investigating,” but it doesn’t indicate what is actually happening or what to do about it. Statistics Canada explained it uses a statistical model to estimate weekly expected deaths based on mortality trends from 2015-19 while considering changes in age, sex and total population. Moreover, whatever is causing it, excess mortality is something the country should pay attention to, she said. “Because clearly there are a lot of people dying that wouldn’t normally have.” (this was a repeat article worth posting again)
2) The Canadian Independent “LOOK: Public Health Ontario has released a new infographic to reassure Ontarians that “vaccines are very safe” regarding adverse events but noted that it omitted information about the COVID-19 vaccine” (see link: https://thecanadianindependent.substack.com/p/look-public-health-ontario-has-released). From the article: One might ask, why would they choose to leave out the COVID-19 vaccines? Well, it may have to do with the fact that, according to Public Health Ontario’s latest March 2024 COVID-19 vaccine safety report, it places ‘other severe or unusual events’ as the number one reported adverse event since the COVID-19 vaccine rollout back in December 2020.
The author of the CotD has combined analyses of Covid-19 and Excess Deaths (all causes) as these are related. Note that this is an update of the January 31, 2024 CotD “Canada Covid and Excess Deaths” and February 2, 2024 “Canada Provisional Weekly Deaths” due to updated revisions within the Statistics Canada database.
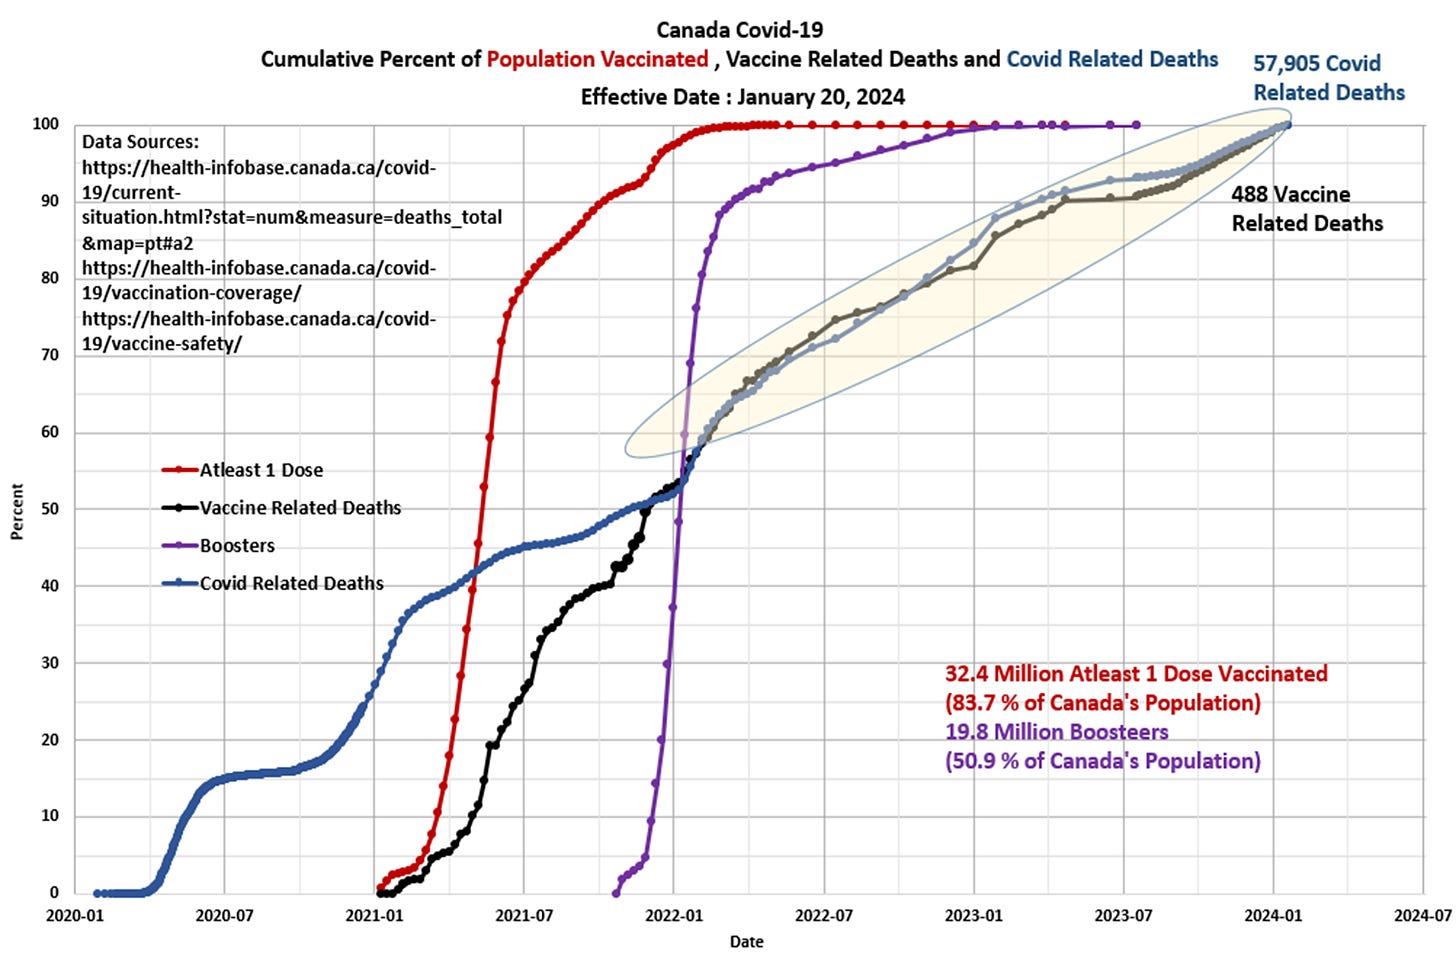
Panel 1 The first graph is a construct by the author as a standard CotD presentation which illustrates Covid-19 Related Deaths (CRDs), Vaccine Related Deaths (VRDs) and vaccinations. The Health Canada database utilized to create this graph has not changed since January 20, 2024 and will be updated in May or June. Canada’s vaccination program was initiated in December 2020 and began to accelerate into the spring/summer of 2021. The Booster program ramped-up significantly in December 2021 and continued with high booster up-take by summer 2022. The near 100 percent correlation in the rates of CRDs and VRDs since November 2021 (highlighted yellow) is stunning and disturbing. A total of 18,627 CRDs have occurred since April 2022 of which an estimated 15,833 CRDs (85 percent average) are vaccinated citizens (based on the Outcomes by Vaccination Status via the Health Canada Epidemiology Reports (see Panel 4 in the April 25th CotD)). Remember, as per Health Canada : “Evidence indicates that vaccines and boosters are effective at helping to prevent serious illness, hospitalization and death due to COVID-19. Evidence indicates that the benefits of COVID-19 vaccines continue to outweigh the risks of the disease. Receiving an mRNA booster dose provides even better protection.” Do you think the data supports these claims by Health Canada?
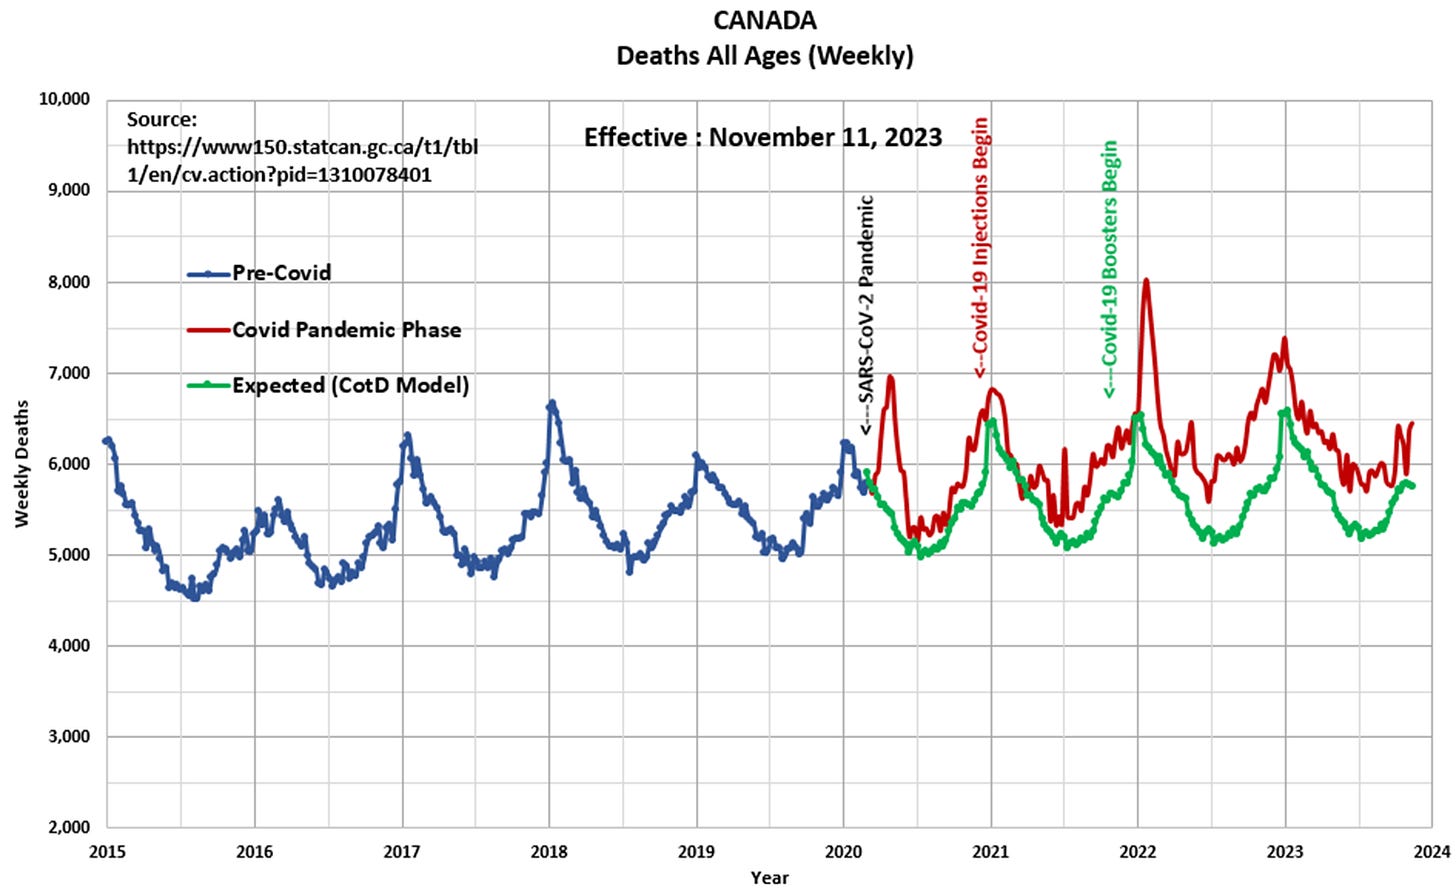
Panel 2 Observe the characteristic cyclical nature of deaths or all-cause mortality since 2015. The “Blue” line represents data prior to March 2020 and the “Red” line represents data since the SARS CoV-2 pandemic was initiated in March 2020. The “Green” line represents the “Expected” deaths (CotD Model) based on historical averages. The author has utilized the data for the five year period January 2015 to December 2019 in order to calculate an average normalized curve for Monthly Deaths. The Expected Deaths (CotD Model) incorporates an average 7.0 percent growth factor which is the highest rate forecast this author has utilized of all CotD analyses to date. This appears to be a good match to the overall pre-pandemic trend.
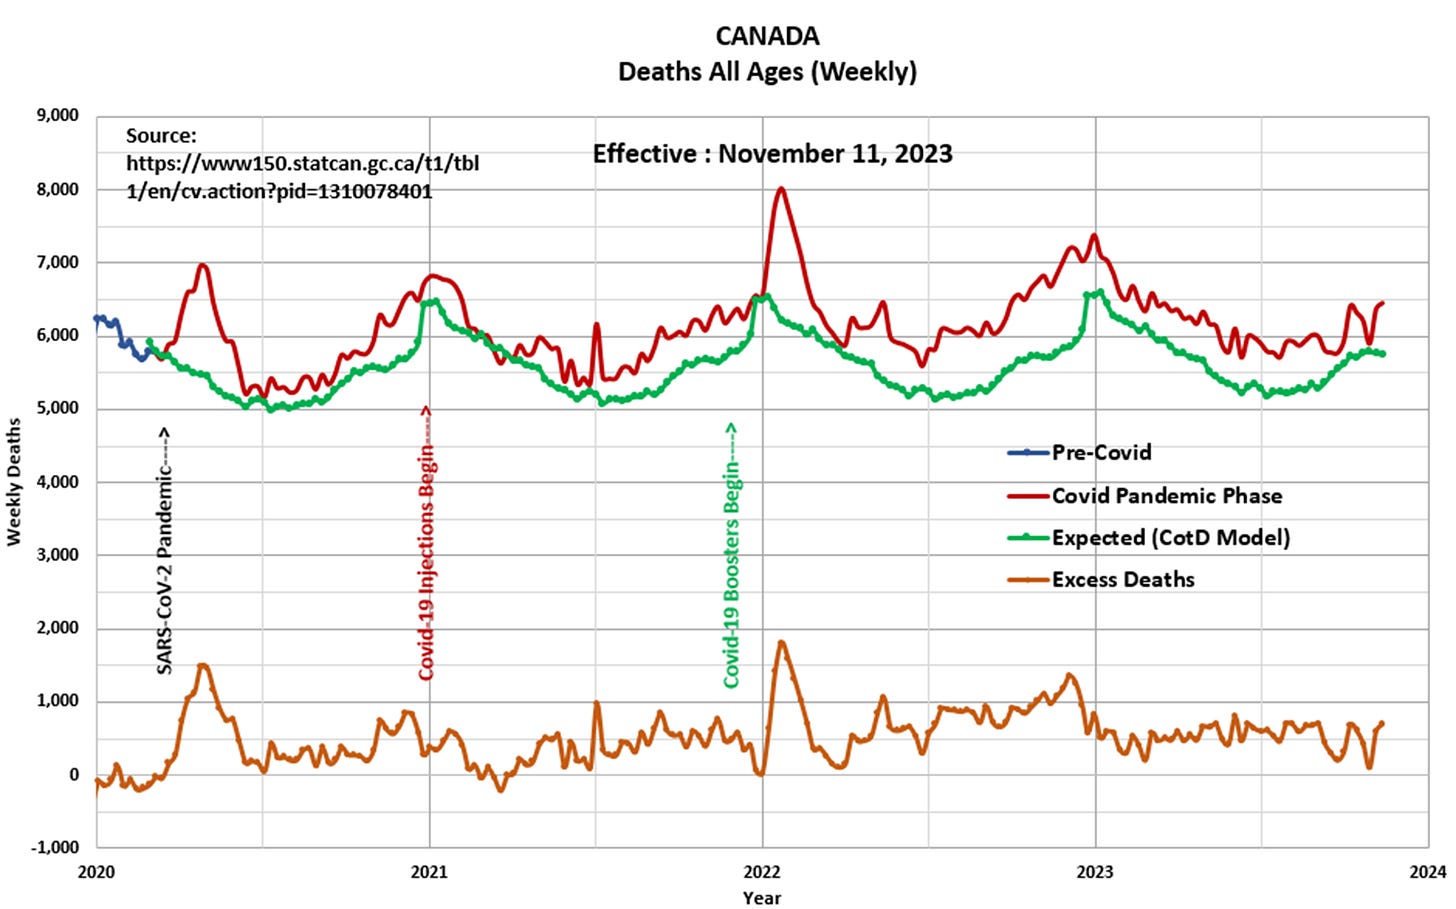
Panel 3 This presents the magnified portion (January 2020 to November 2023) of the graph in Panel 2. The “Orange” line represents “Excess Deaths” which is calculated by subtracting Expected Deaths from Official Deaths.
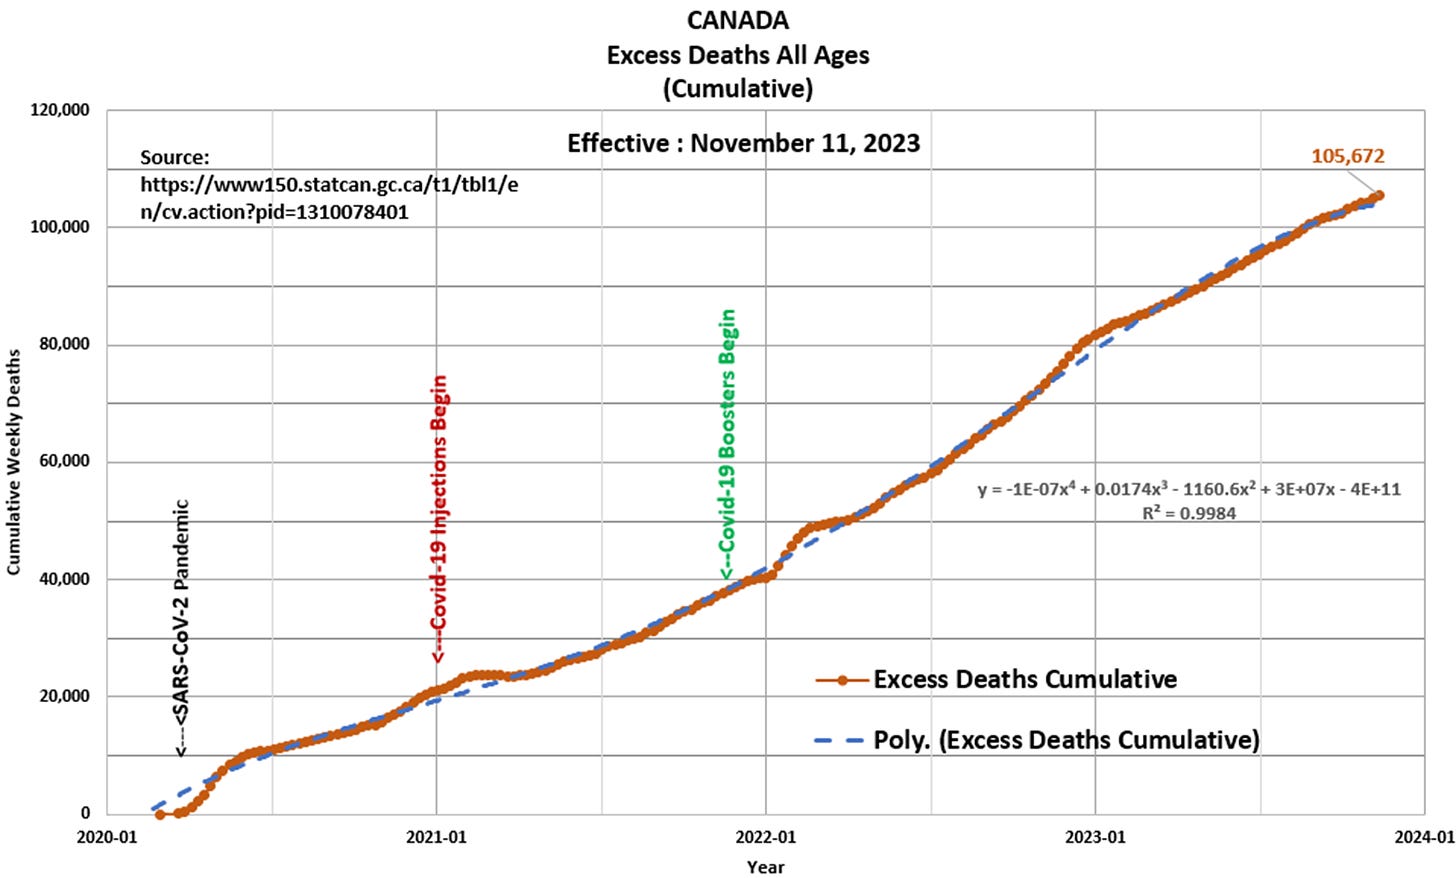
Panel 4 Based on the data and this author’s model, 105,672 Excess Deaths have occurred since the start of the pandemic of which 85,775 (81 percent) have occurred since the start of Covid-19 injections in December 2020. This compares to 102,357 Excess Deaths to September 2, 2023 as per the Excess Mortality Tracker website (see https://covid19resources.ca/public/excess-mortality-tracker/ ). Note the blue-dashed curve is a polynomial (non-linear) best-fit to the data up-trend. In essence, this reveals that the Excess Death Rate (EDR) is accelerating with time, which is a strong signal something is abnormal within Canada’s population. Once again, the question is “why is this occurring?
Panel 5 This is a graphical presentation of Canada’s “Provisional Weekly Death Counts” from 2010 utilizing the Statistics Canada database. The year 2010 is a baseline starting point for this analysis. This graph is a construct of the author as Statistics Canada does not provide this type of presentation (as far as the author is aware). In terms of statistical and mathematical terms, this graph is not only unique, but perfect in the sense that the “best fit” polynomial curve to the data matches 100 percent to the data as revealed by R2=1. Also, the data curve is trending upward which essentially reveals the deaths are accelerating over time. It appears something abnormal is occurring to Canadian citizens.

Panel 6 The following table presents the Cause of Death categories as per Statistics Canada : https://www150.statcan.gc.ca/t1/tbl1/en/cv.action?pid=1310081001. Utilizing data within the Statistics Canada website, a summary table was created depicting two recent periods for comparison purposes (March 15, 2020 to December 31, 2022 and January 1 to November 11, 2023). The majority of the categories have been in the database for many years (since 2010) with the exception of two recent categories, namely, “COVID-19” and “Information Unavailable”. The “Information Unavailable” (InfoUn) category had no data (i.e. deaths) prior to January 1, 2020. For the period March 15, 2020 to December 31, 2022, the InfoUn category averaged about 36 deaths per week, which is unusual in itself, as medical doctors, examiners and coroners are required to define a Cause of Death. Note the eye-popping change to InfoUn deaths to 1,606 per week (4,349 percent increase) during 2023 from the previous period. In addition, note the negative Percent Change to essentially all of the categories to offset the massive positive change in InfoUn deaths. The question being is “what is going on at StatsCan?” Also of note is that Statistics Canada has apparently reviewed some 3.8 million death reports in a matter of two months (since the September 9, 2023 database) resulting in a reduction of 66,565 deaths in the “Information Unavailable” and “Ill-defined/Unspecified” categories and redistributed these deaths (in a random fashion) among the other listed categories.
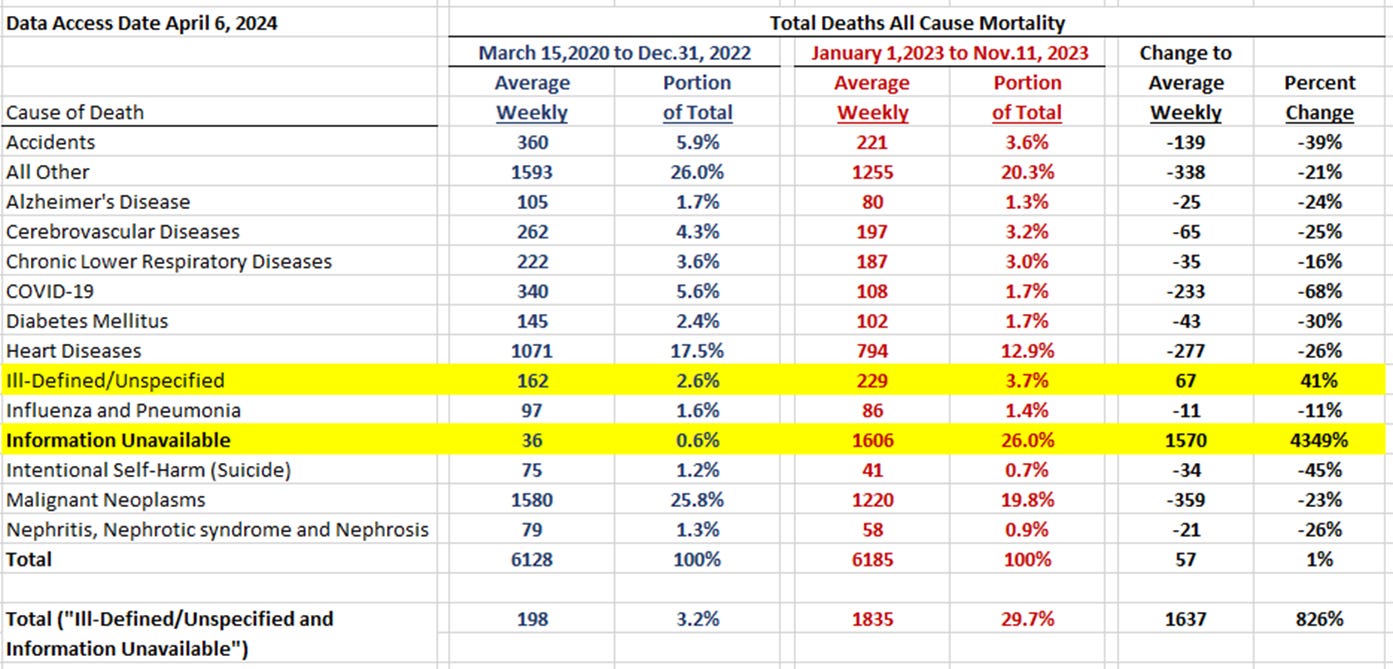
Panel 7 The author of the CotD was shocked by this dataset presentation as it relates to the combined “Information Unavailable” plus “Ill-defined/Unspecified” (InfoUn & IllDef)) deaths. Based on Statistics Canada, InfoUn & IllDef deaths in 2023 are the cause for nearly 30 percent of all deaths in Canada which is absolutely outrageous to say the least. Even more shocking is that based on the recent November data, the InfoUn & Ill Def deaths account for over 52 percent of total deaths in Canada. Note the InfoUn death category was initiated in early 2020 (coincidentally at the start of the pandemic). Is this one of the smoking guns?

“Be not afraid of greatness…some are born great, some achieve greatness, and some have greatness thrust upon them” William Shakespeare
Subscribe to Eldric Vero Substack


