by Eldric Vero
This CotD was inspired by two recent articles:
1) S&P Global Ratings “Various Rating Actions Taken On Canadian Municipal Governments On Improved Institutional Framework Assessment” (see link: https://disclosure.spglobal.com/ratings/en/regulatory/article/-/view/type/HTML/id/2847973 ). From the article: Canadian municipalities remain among the highest-rated local government issuers outside of the U.S. An extremely predictable and supportive framework, which encompasses strong revenue and expenditure management, and a high degree of transparency bolster our view of the systems’ already favorable economic, financial, and management profiles.
2) LiveWire Calgary “City of Calgary retains high credit rating from top firms” (see link: https://livewirecalgary.com/2023/07/20/city-of-calgary-retains-high-credit-rating-from-top-firms/ ). From the article: The City of Calgary has passed the latest round of credit rating reviews from global rating firms S&P and DBRS Morningstar, retaining high credit ratings from both organizations. S&P formally gave their AA+ issue creditor rating to the City on July 13, while DBRS gave an AA (high) and R-1 (high) rating to long-term debt and commercial paper. “The ratings are supported by the City’s approach to fiscal management, its relatively low debt burden, and its robust liquidity. However, Calgary’s credit profile is vulnerable to volatility in the global energy markets,” wrote DBRS. “All trends are stable”.
The author of the CotD has reviewed the City of Calgary Annual Financial Reports since 2006 (see link : https://www.calgary.ca/our-finances/annual-reports.html ) . This table is a quick summary of changes to operating costs, debt and total liabilities:

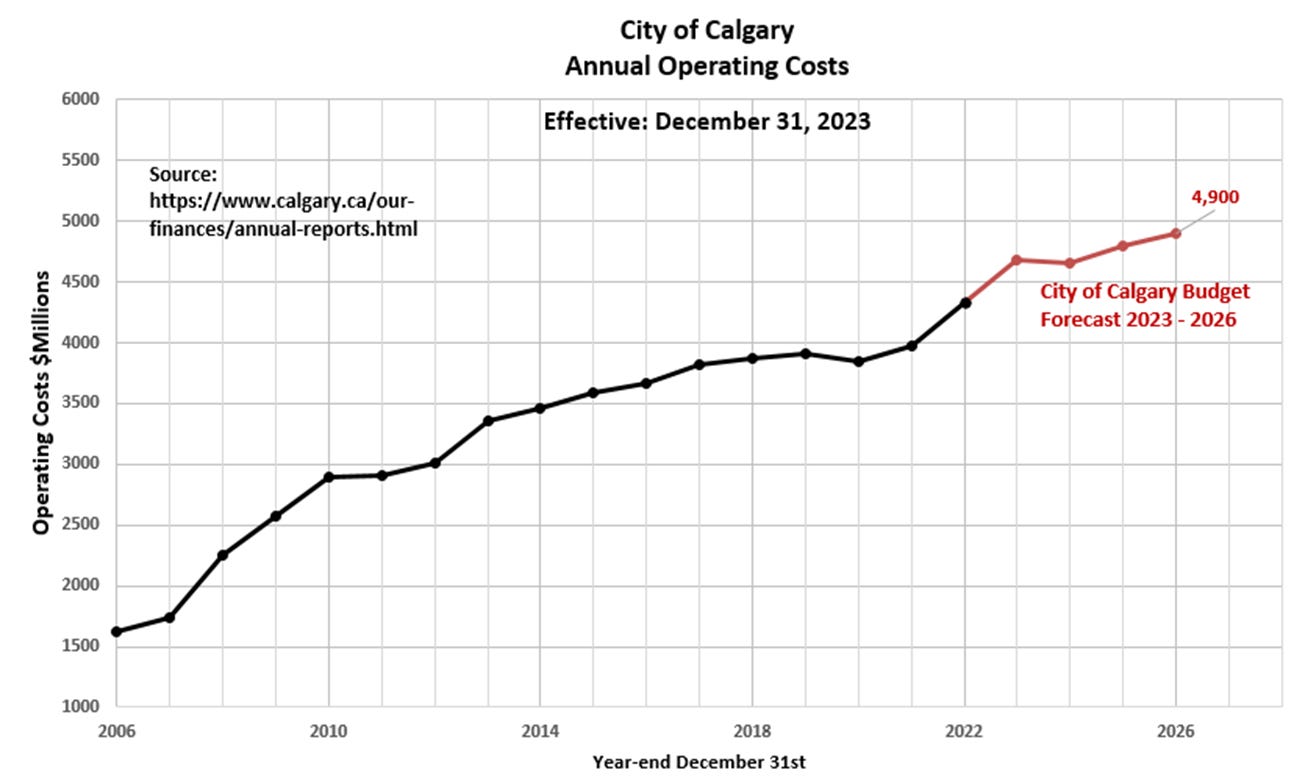
Panel 1 The first graph is a construct by the author presenting the Annual Operating Costs. Annual Operating Costs have increased from $1.62 Billion to $4.34 Billion ($2.71 Billion) since 2006. This is an increase of 167 percent over 16 years (an average rise of 6.3% per year). For comparison, the official average consumer price index (CPI) has been in the order of 2% per year over the same time period. Once again, is this growth in operating costs sustainable?

Panel 2 This graph presents the Cumulative Long-Term Debt and Total Liabilities as per the Financial Annual Reports. Note that since 2014, Total Long-Term Debt has decreased and Total Liabilities have stabilized indicating the City of Calgary is managing finances in a prudent manner. It appears the City of Calgary is financially stable and in a relatively secure financial position going forward. ENMAX (electricity distribution utility) is included in this graph as the City of Calgary is the sole shareholder of this corporation.

Panel 3 This is a presentation of Annual Deficits (the author’s definition) based on the change in Total Liabilities. The Deficit Forecast is challenging to predict, however, based on the City of Calgary’s financial stability, it is reasonable to assume a relatively flat to low growth rate in overall Total Liabilities in the near term.

“The decision to go into debt alters the course and condition of your life. You no longer own it…you are owned” Dave Ramsey
Support Eldric Vero Substack
Quaecumque vera


