by Eldric Vero
March 25, 2024
This CotD was inspired by two recent articles:
1) The Canadian Press “COVID vaccines don’t cause cancer. But false claims persist in sea of misinformation” (see link: https://www.msn.com/en-ca/health/other/covid-vaccines-dont-cause-cancer-but-false-claims-persist-in-sea-of-misinformation/ar-BB1kouh6 ). From the article: Anyone who spends even a moderate amount of time online has likely come across social media posts falsely claiming that COVID-19 vaccines are harmful to human health. Among the most widely debunked claims is that vaccines developed with messenger RNA technology can cause cancer because they contain “monkey virus DNA. Such claims were even repeated during a U.S. congressional hearing on vaccine injuries last year, but North American and European health authorities have stressed that there is no proof of a causal link between COVID vaccines and cancer, or that mRNA vaccines can alter human DNA in any way.
2) Winnipeg City News “COVID vaccination rates dismal across Canada 4 years after pandemic was declared” (see link: https://winnipeg.citynews.ca/2024/03/11/coivd-vaccination-rates-dismal-across-canada-four-years-after-pandemic-was-declared/ ). From the article: Across the country, dismal vaccination rates against COVID-19, with only 18 per cent of the population in Manitoba receiving their recommended dose of the vaccine. Dr. Joss Reimer, chief medical officer for the Winnipeg Regional Health Authority says people have to consider COVID boosters as another seasonal activity that they do. “I know it feels very frustrating to have to keep going and getting another vaccine, but what I want people to think about is that it’s a way of maintaining your health.”
The author of the CotD has combined analyses of Covid-19 and Excess Deaths (all causes) as these are related.
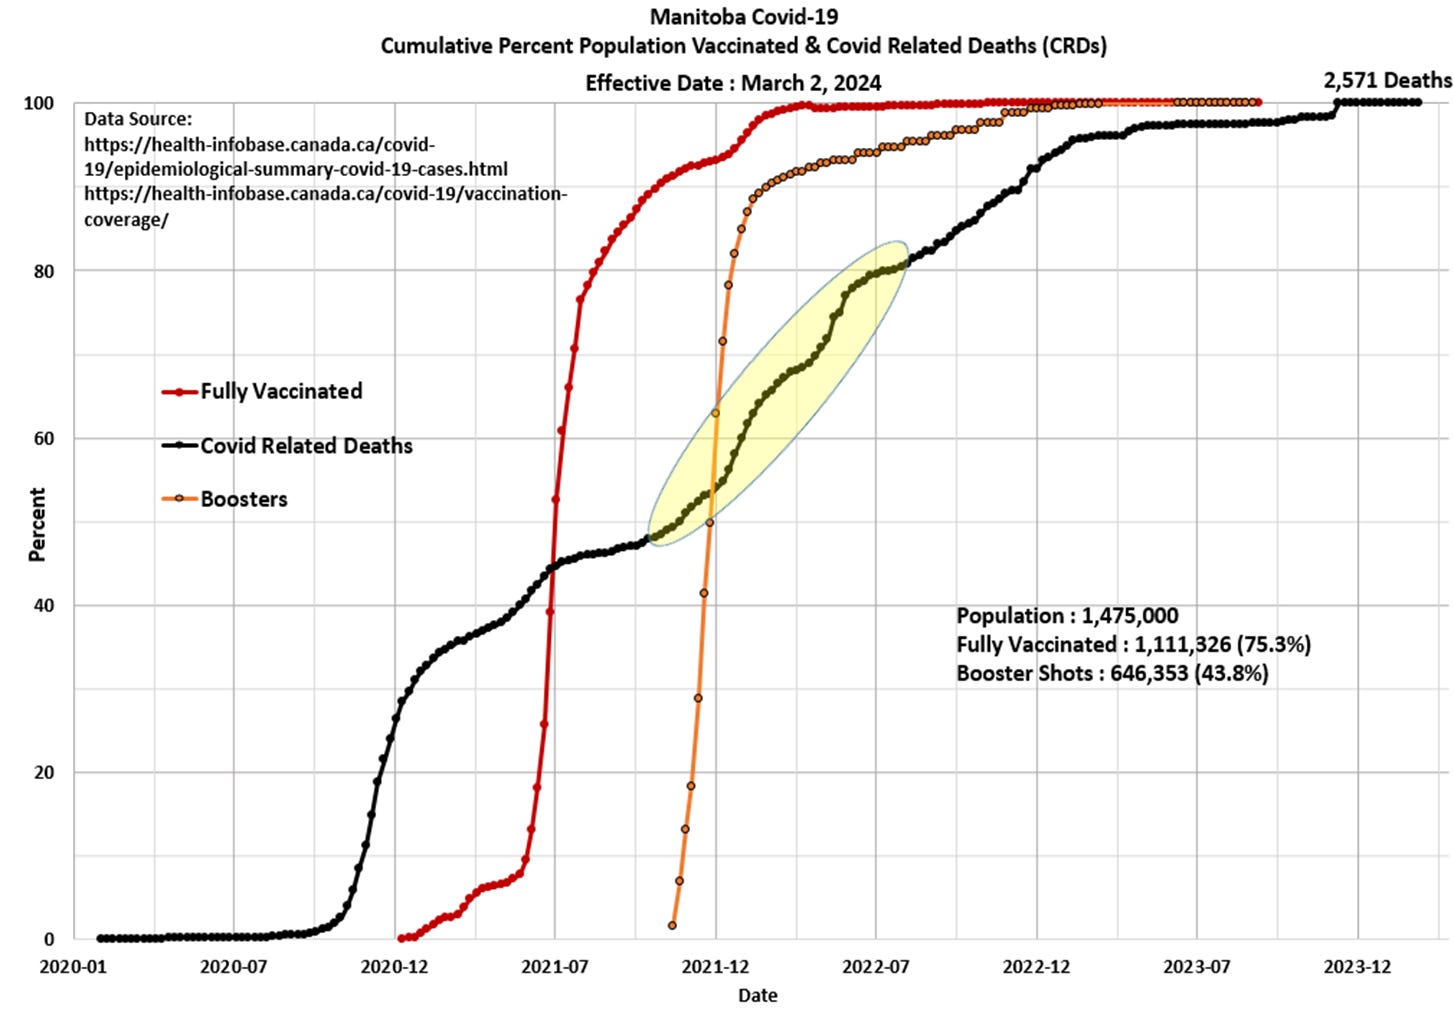
Panel 1 The first graph is a construct by the author as a standard CotD presentation which illustrates Covid-19 Related Deaths (CRDs) and vaccinations. Manitoba’s vaccination program was initiated in January 2021 and began to accelerate into the spring/summer of 2021. There appeared to be some success to vaccination by Q3 2021 as the CRD rate decreased somewhat with approximately 65 percent of the population fully vaccinated. The Booster program ramped-up significantly in December 2021 and continued with high booster up-take rates into Spring 2022. Note the significant increase in the CRD rate (highlighted yellow) coincident to the Booster injections which is perplexing and disturbing. A total of 1,900 CRDs (74 percent of the total) have occurred since January 2021. There have been no additional CRDs since November 2023 (i.e. the curve is flat) in concert with very low additional booster injection up-take. Remember, as per Health Canada : “Evidence indicates that vaccines and boosters are effective at helping to prevent serious illness, hospitalization and death due to COVID-19. Evidence indicates that the benefits of COVID-19 vaccines continue to outweigh the risks of the disease. Receiving an mRNA booster dose provides even better protection.” Do you think the data supports these claims by Health Canada?
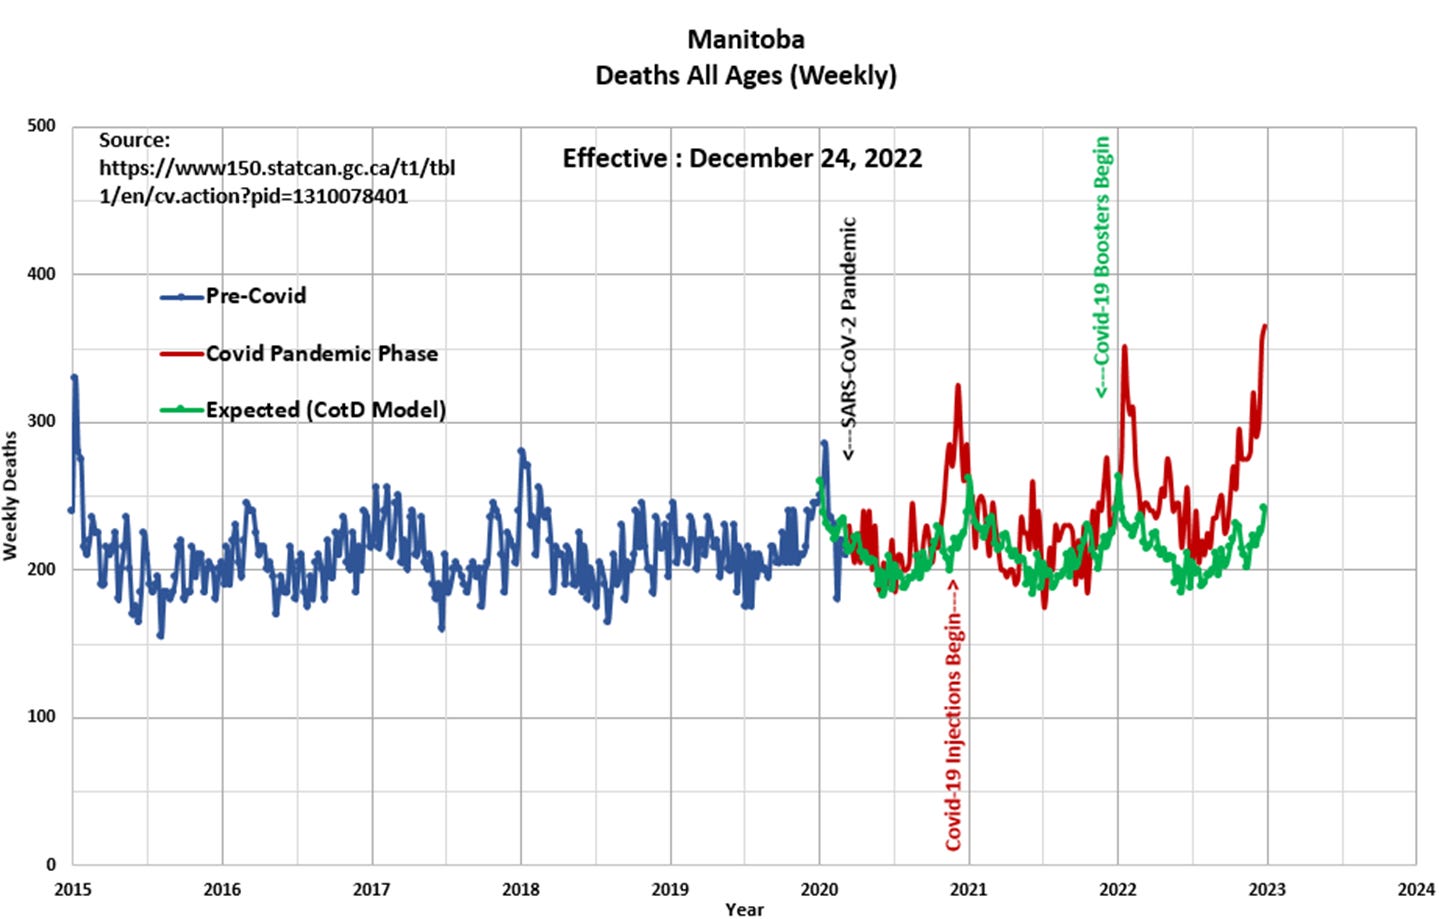
Panel 2 Observe the characteristic cyclical nature of deaths or all-cause mortality since 2015. The “Blue” line represents data prior to March 2020 and the “Red” line represents data since the SARS CoV-2 pandemic was initiated in March 2020. The “Green” line represents the “Expected” deaths (CotD Model) based on historical averages. The author has utilized the data for the five year period January 2015 to December 2019 in order to calculate an average normalized curve for Monthly Deaths. The Expected Deaths (CotD Model) incorporates an average 2.0 percent growth factor which appears to be a good match to the overall pre-pandemic trend. Note that the Statistics Canada database is incomplete as the data is current only to December 24, 2022 (the Manitoba data is almost 12 months behind the rest of Canada).
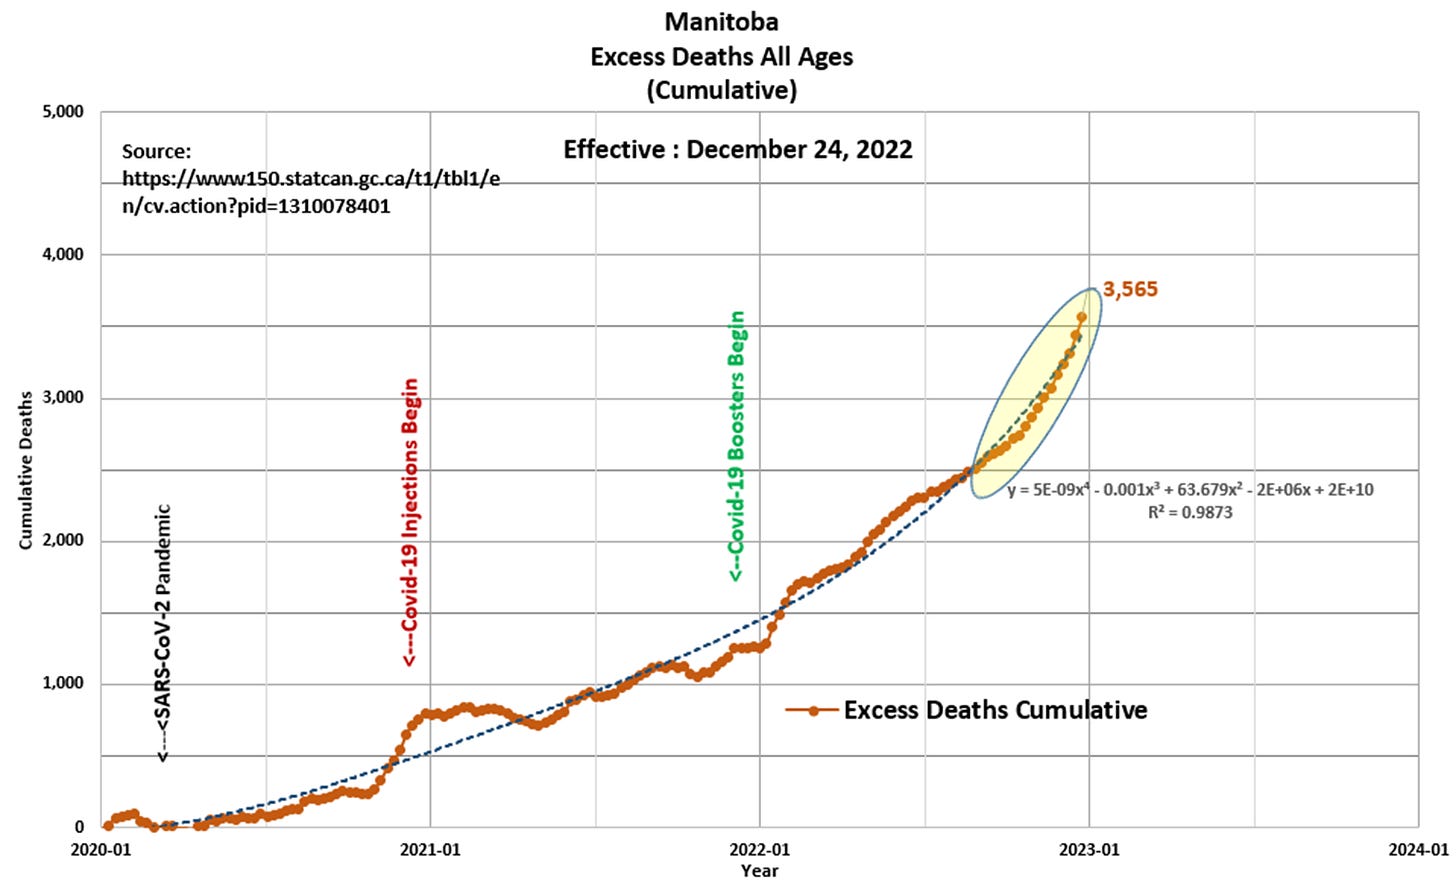
Panel 3 This presents the magnified portion (January 2020 to December 2022) of the graph in Panel 2. The “Orange” line represents “Excess Deaths” which is calculated by subtracting Expected Deaths from Official Deaths.
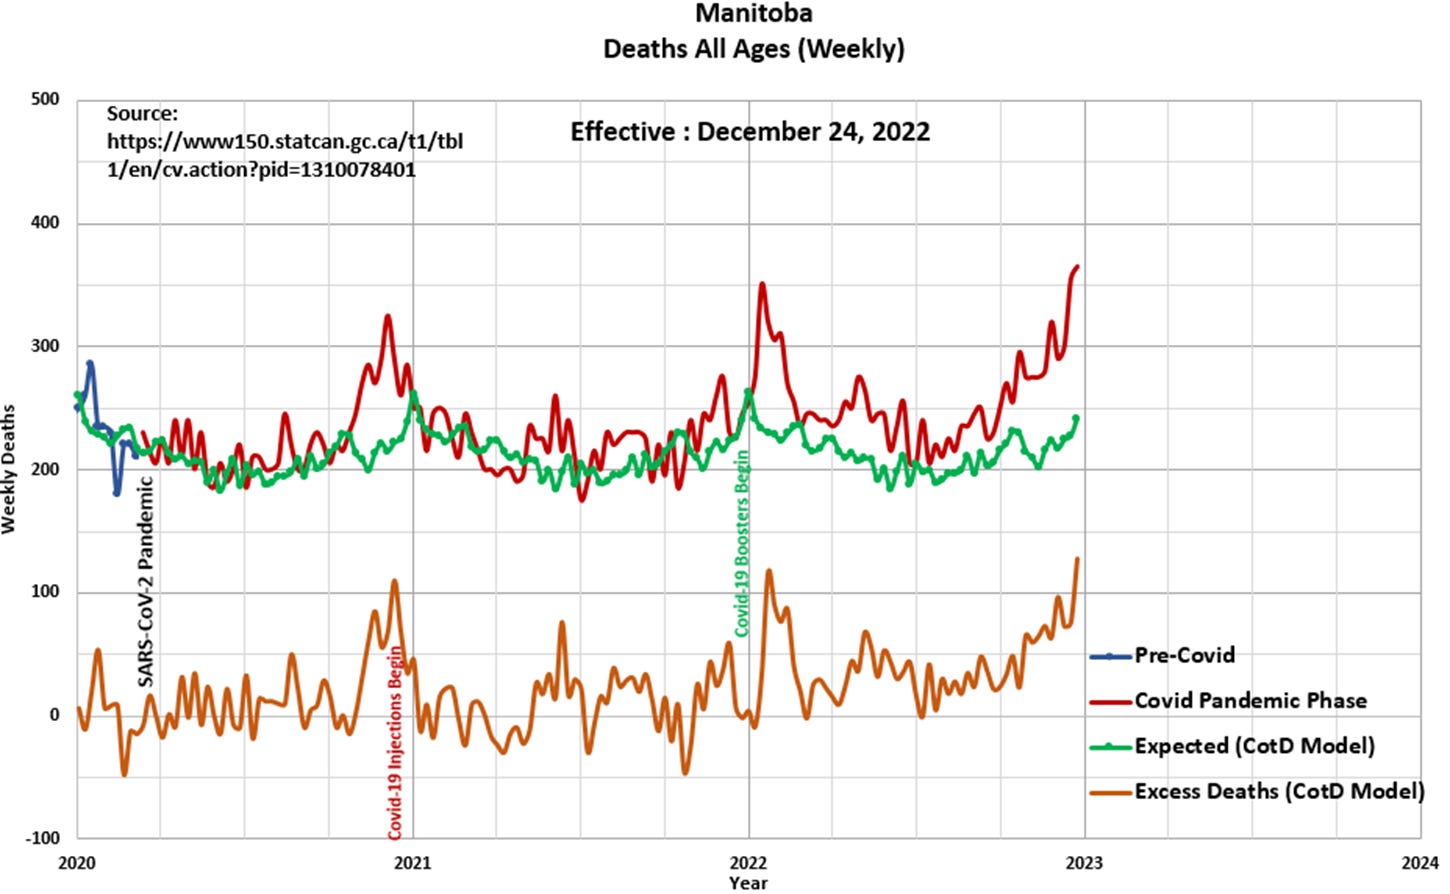
Panel 4 Based on the data and this author’s model, 3,565 Excess Deaths have occurred since the start of the pandemic of which 2,850 (80 percent) have occurred since the start of Covid-19 injections in December 2020. This compares to 3,804 Excess Deaths since January 2021 as per the Statistic Canada website (remember there is almost 12 months of data missing from the Statistics Canada database). The blue-dashed curve is a polynomial (non-linear) best-fit to the data up-trend. Note the hyperbolic-like curve shape in Q3-Q4 2022. In essence, this reveals that the Excess Death Rate (EDR) is accelerating with time, which is a strong signal something is abnormal within Manitoba’s population. Once again, the question is “why is this occurring?
Never be afraid to raise your voice for honesty and truth and compassion against injustice and lying and greed. If people all over the world would do this, it would change the earth”. William Faulkner
Support Eldric Vero Substack
Quaecumque vera


