by Eldric Vero
January 31, 2024
This CotD was inspired by two recent articles:
1) Deutsche Welle (DW) News “Post-COVID vaccination syndrome: What do we know?” (see link: https://www.dw.com/en/post-covid-vaccination-syndrome-what-do-we-know/a-65898312 ). From the article: Like long COVID, post-COVID vaccination syndrome is characterized by a wide variety of symptoms and clinical pictures including chronic fatigue syndrome (CFS/ME), migraines, muscle pain or cardiovascular diseases. As multifaceted as the symptoms may be, they have one thing in common: They can occur in those affected shortly after COVID vaccination. In early July 2023, the International Coalition of Medicines Regulatory Authorities (ICMRA) said “there is no evidence that COVID-19 vaccines are causing excess mortality. In fact, COVID-19 vaccines have saved millions of lives.”
2) The Expose News “Researchers urge governments to endorse a global moratorium on mRNA injections in a newly released science paper” (see link: https://expose-news.com/2024/01/26/researchers-urge-a-global-moratorium-on-mrna/ ). From the article: “Re-analysis of the Pfizer trial data identified statistically significant increases in serious adverse events (SAEs) in the vaccine group,” the researchers wrote. Adding, “Numerous SAEs were identified following the Emergency Use Authorisation (EUA), including death, cancer, cardiac events, and various autoimmune, haematological, reproductive, and neurological disorders.” As the paper noted, Pfizer’s covid “vaccines” never underwent adequate safety and toxicological testing according to previously established scientific standards. It goes on to detail the absolute risk reduction, the underreporting of harms during trials, the shifting narratives and illusions of protection, quality control and manufacturing the vaccine is ineffective.
The author of the CotD has combined analyses of Covid-19 and Excess Deaths (all causes) as these are related. Note that this is an update of the November 14, 2023 CotD “Canada All Cause Mortality and Excess Deaths” due to updated revisions within the Health Canada database.
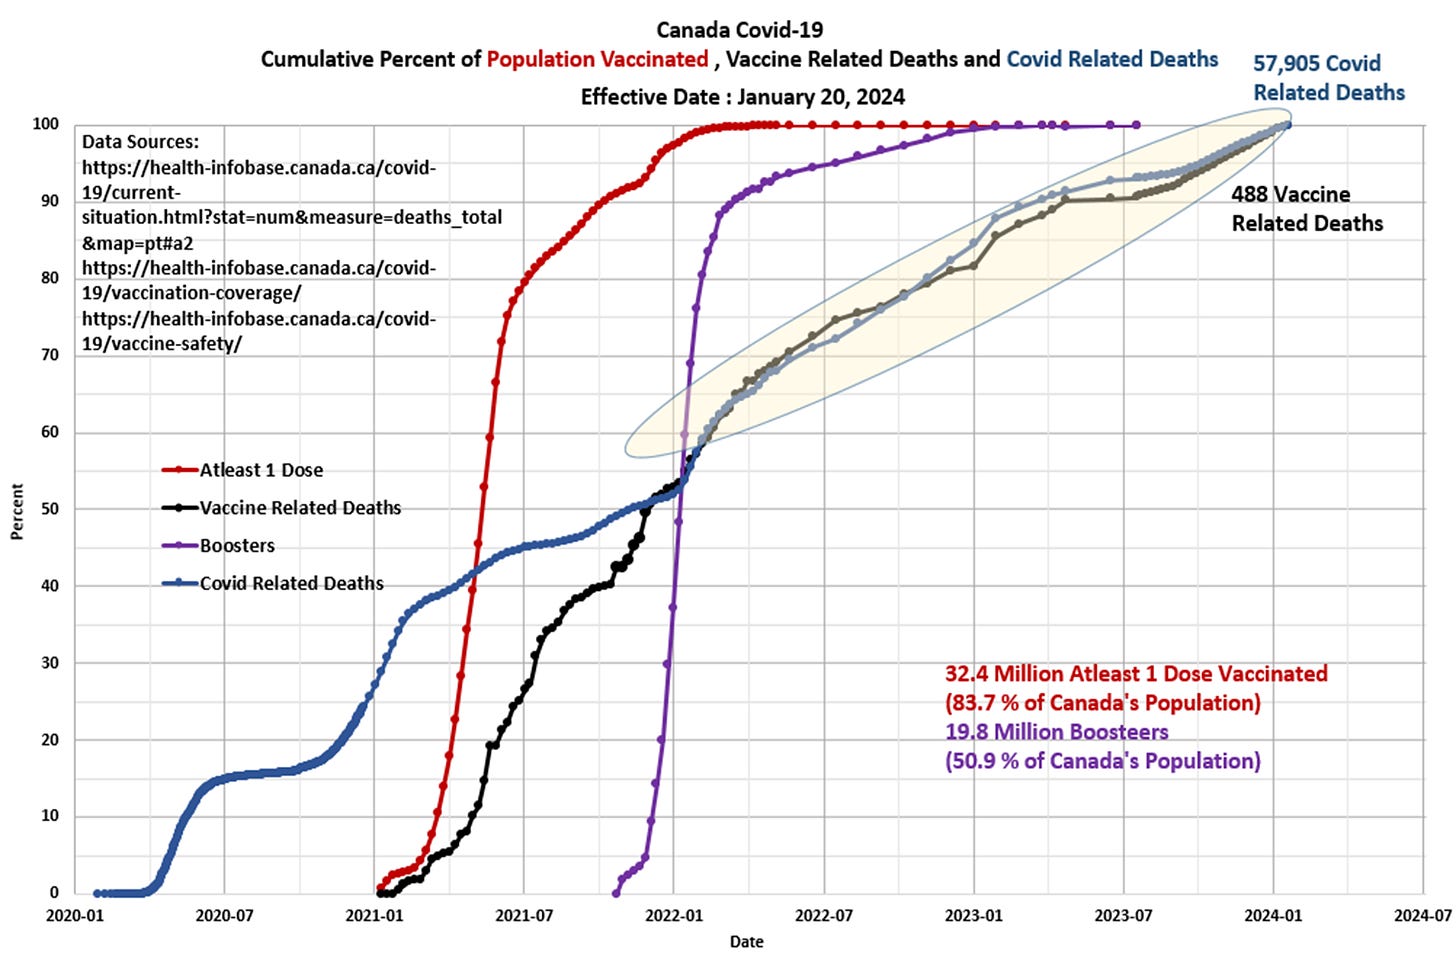
Panel 1 The first graph is a construct by the author as a standard CotD presentation which illustrates Covid-19 Related Deaths (CRDs), Vaccine Related Deaths (VRDs) and vaccinations. Canada’s vaccination program was initiated in December 2020 and began to accelerate into the spring/summer of 2021. The Booster program ramped-up significantly in December 2021 and continued with high booster up-take by summer 2022. The near 100 percent correlation in the rates of CRDs and VRDs since November 2021 (highlighted yellow) is stunning and disturbing. A total of 18,627 CRDs have occurred since April 2022 of which an estimated 15,833 CRDs (85 percent average) are vaccinated citizens (based on the Outcomes by Vaccination Status via the Health Canada Epidemiology Reports (see Panel 4 in the April 25th CotD)). Remember, as per Health Canada : “Evidence indicates that vaccines and boosters are effective at helping to prevent serious illness, hospitalization and death due to COVID-19. Evidence indicates that the benefits of COVID-19 vaccines continue to outweigh the risks of the disease. Receiving an mRNA booster dose provides even better protection.” Do you think the data supports these claims by Health Canada?

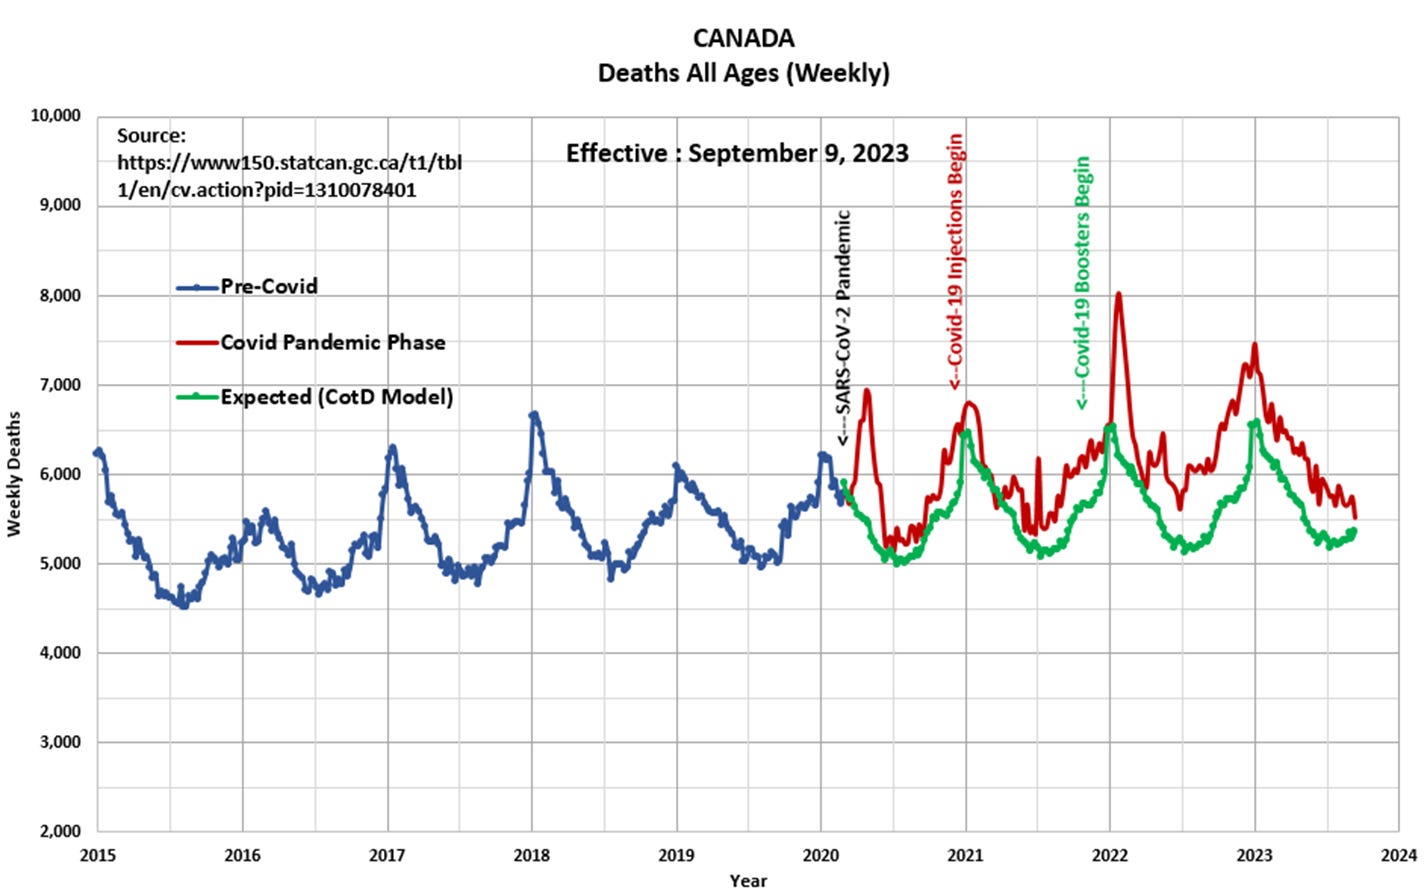
Panel 2 Observe the characteristic cyclical nature of deaths or all-cause mortality since 2015. The “Blue” line represents data prior to March 2020 and the “Red” line represents data since the SARS CoV-2 pandemic was initiated in March 2020. The “Green” line represents the “Expected” deaths (CotD Model) based on historical averages. The author has utilized the data for the five year period January 2015 to December 2019 in order to calculate an average normalized curve for Monthly Deaths. The Expected Deaths (CotD Model) incorporates an average 7.0 percent growth factor which is the highest rate forecast this author has utilized of all CotD analyses to date. This appears to be a good match to the overall pre-pandemic trend.

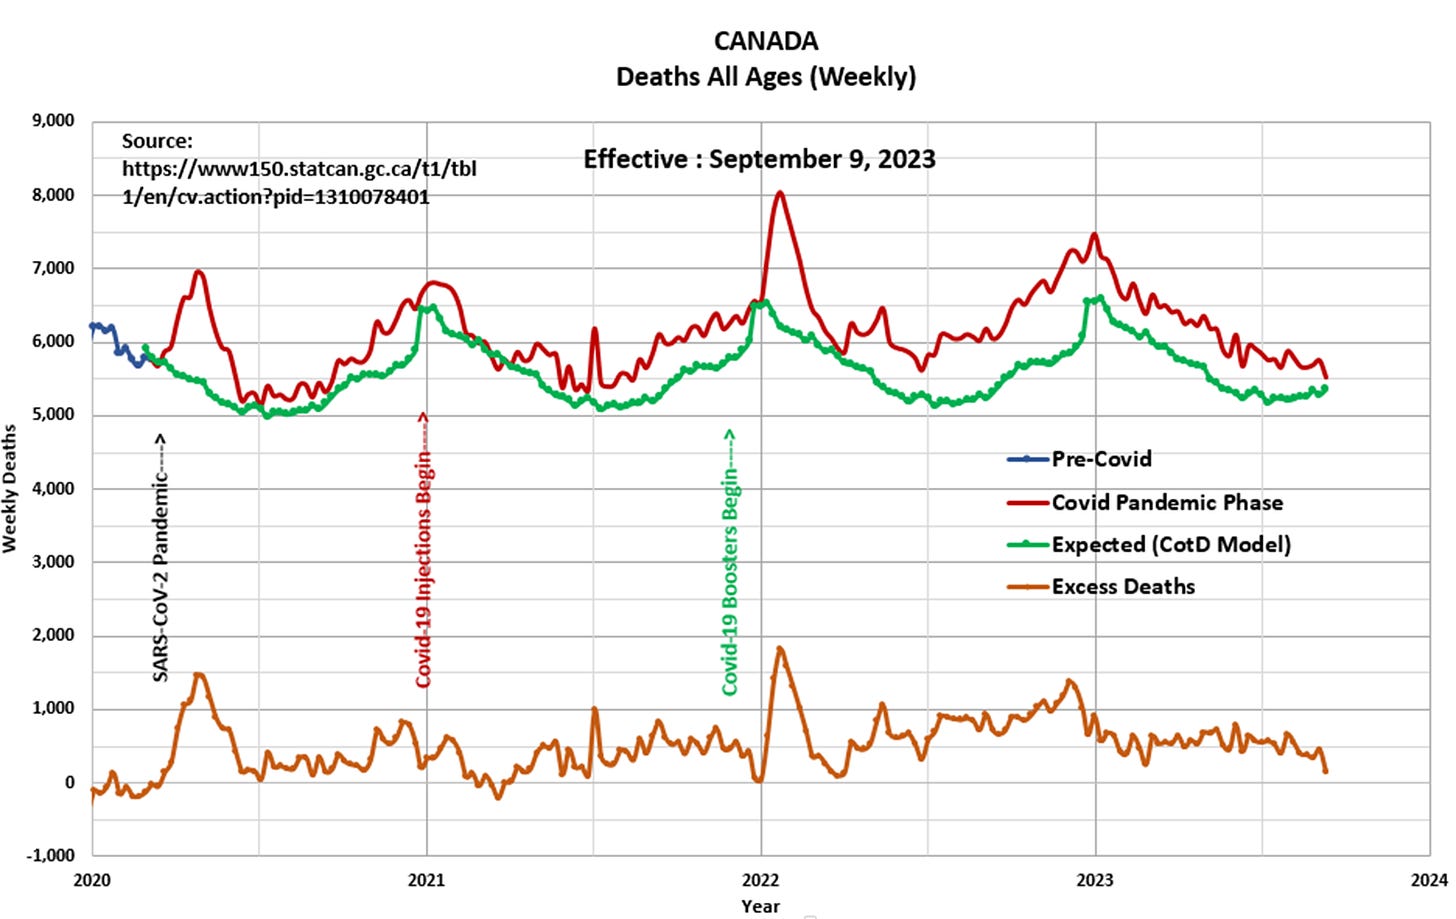
Panel 3 This presents the magnified portion (January 2020 to September 2023) of the graph in Panel 2. The “Orange” line represents “Excess Deaths” which is calculated by subtracting Expected Deaths from Official Deaths.

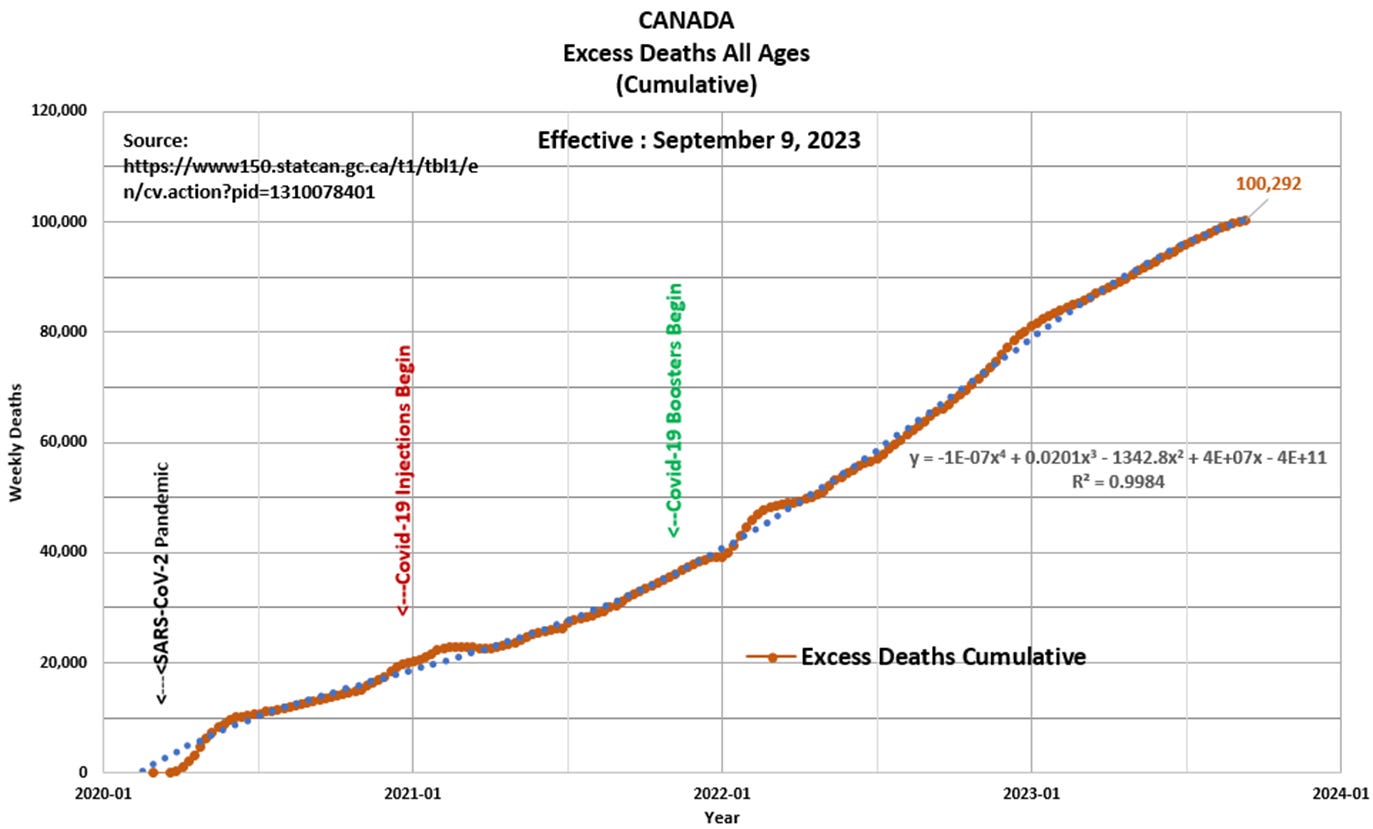
Panel 4 Based on the data and this author’s model, 100,292 Excess Deaths have occurred since the start of the pandemic of which 81,126 (81 percent) have occurred since the start of Covid-19 injections in December 2020. This compares to 64,170 Excess Deaths since January 2021 as per the https://ourworldindata.org/grapher/cumulative-excess-deaths-covid?country=~CAN website. Note the blue-dotted curve is a polynomial (non-linear) best-fit to the data up-trend. In essence, this reveals that the Excess Death Rate (EDR) is accelerating with time, which is a strong signal something is abnormal within Canada’s population. Once again, the question is “why is this occurring?

“Every lie we tell incurs a debt to the truth…Sooner or later that debt is paid.” Valery Legasov, Soviet Nuclear Chemist
Support Eldric Vero Substack
Quaecumque vera


