by Eldric Vero
January 18, 2024
This CotD was inspired by Super Sally’s Newsletter “Thailand’s MSM Finally Picks Up Vaccine Harm” (see link: supersally.substack.com/p/thailands-msm-finally-picks-up-vaccine)
The Newsletter article includes two important news items related to vaccine adverse effects:
1) Bangkok Post “Long Covid, vaccines may cause disease and death; Chula,Rangsit”
2) Thailand Medical News “BREAKING COVID-19 News! Thailand Doctors Finally Speak Up Against COVID-19 Vaccines and Long COVID! Investigations Should Be Initiated!”
In addition, Super Sally includes some good graphs related to Covid deaths, vaccinations and excess deaths (nice work!).
The author of the CotD has combined analyses of Covid-19 and Excess Deaths (all causes) as these are related.
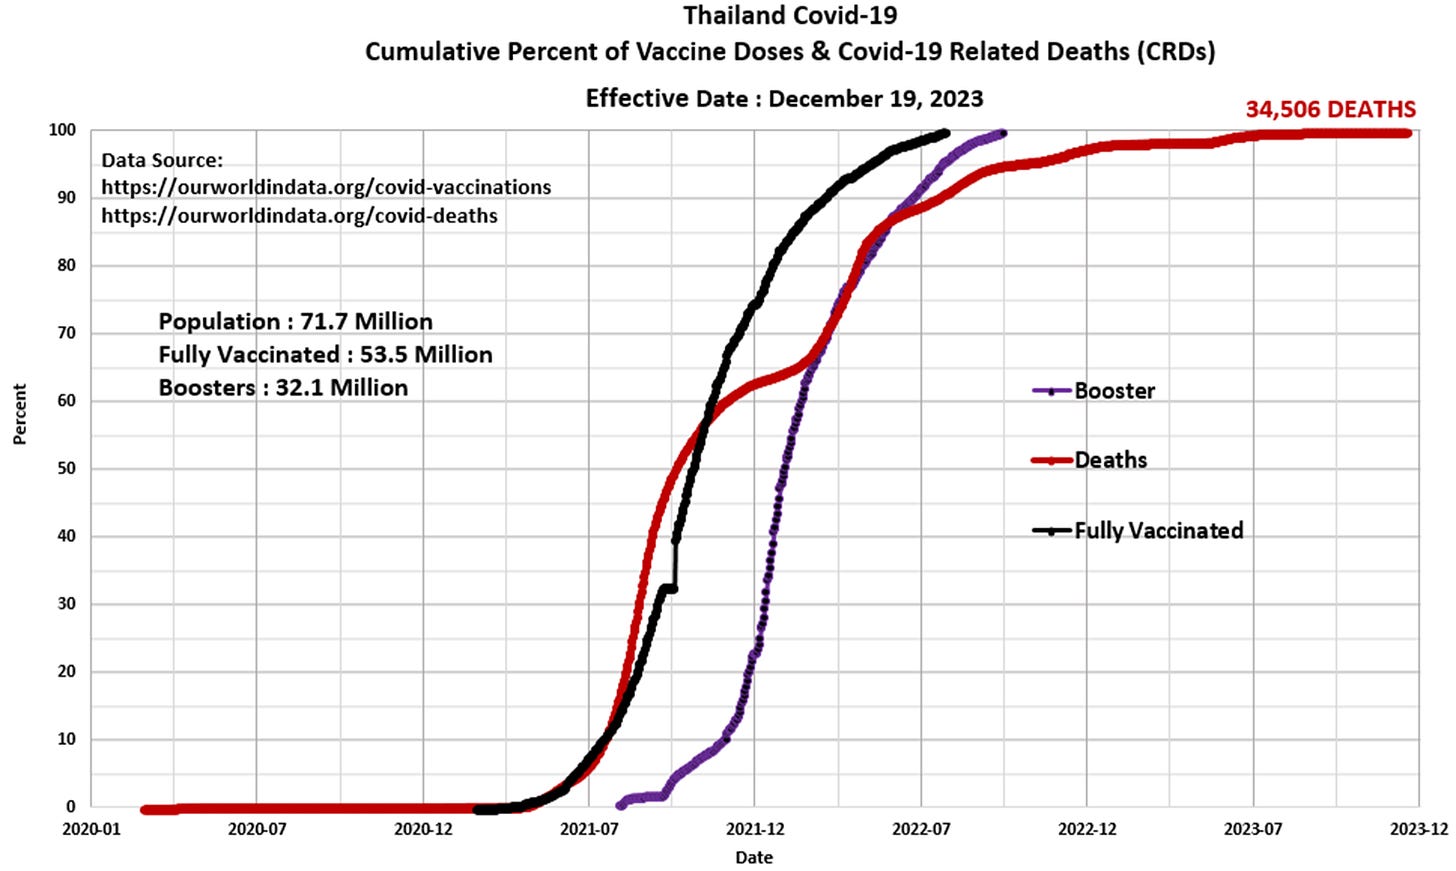
Panel 1 The first graph is a construct by the author as a standard CotD presentation which illustrates Covid-19 related deaths (CRDs) and vaccinations. Thailand’s Covid-19 Related Death (CRD) rate was essentially “zero” since announcement of the SARS-CoV-2 pandemic in March 2020. The vaccination program started in March 2021 with high injection uptake rates into Q1’2022. The vaccination-to-deaths correlation of near 100 percent in 2021 alone is remarkable in itself. The booster program started in Q3’2021 with continued high injection rates into Q2’2022, however, the CRD rate continued to rise into mid-2022. Again, the booster vaccinations-to-death correlation in Q1/Q2’2022 is absolutely stunning as both profiles are identical. The vaccination data ends in October 2022 in the ourworldindata.org website. Since Q1’2023, the CRD rate has lessened significantly in concert with assumed low vaccine injection rates.

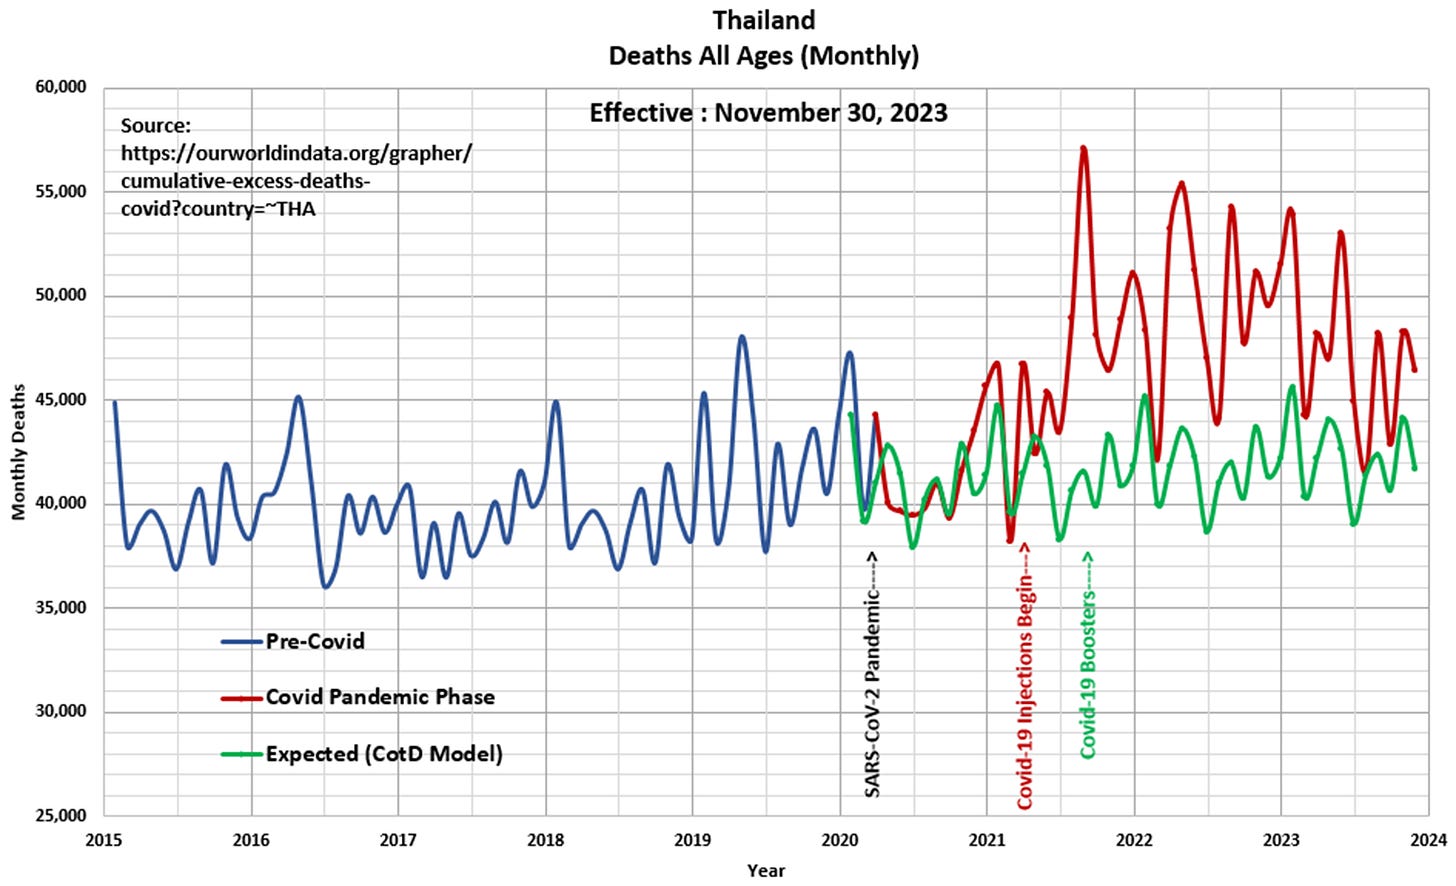
Panel 2 Observe the rather irregular cyclical nature of deaths or all-cause mortality since 2015. The “Blue” line represents data prior to March 2020 and the “Red” line represents data since the SARS CoV-2 pandemic was initiated in March 2020. The “Green” line represents the “Expected” deaths (CotD Model) based on historical averages. It was somewhat challenging to model the historical data, however, as Dr. McCoy (Bones) indicated to Spock “well then, you’ll have to take your best shot…your best guess” which is what the author can only do (see Star Trek 4). Data for the five year period January 2015 to December 2019 was utilized in order to calculate an average normalized curve for Monthly Deaths. The Expected (CotD Model) deaths incorporates an average 4.0 percent growth factor which appears to be a good match to the overall trend.

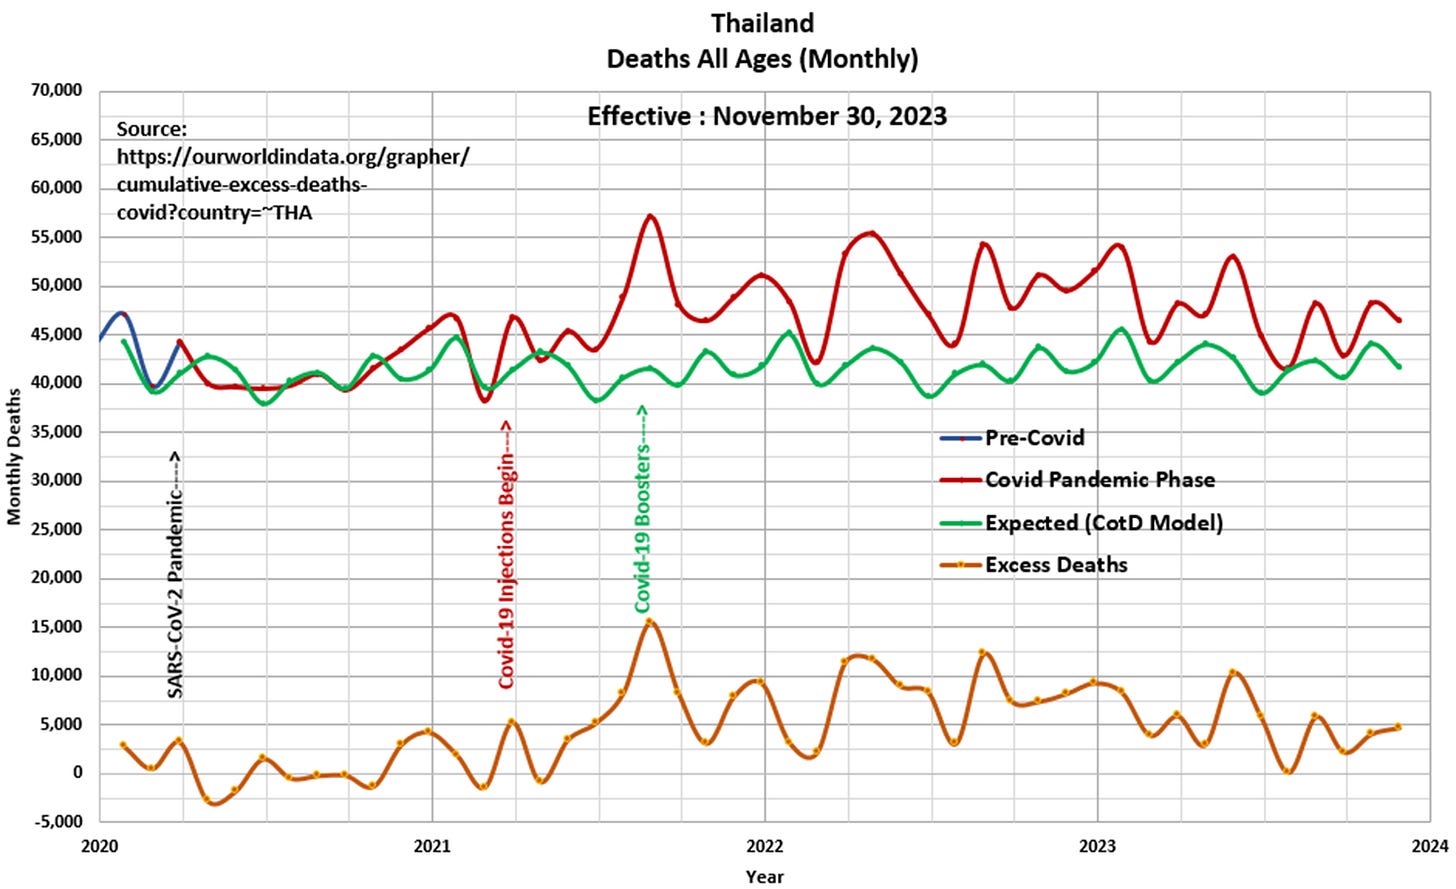
Panel 3 This presents the magnified portion (January 2020 to November 2023) of the graph in Panel 2. The “Orange” line represents “Excess Deaths” which is calculated by subtracting Expected Deaths from Official Deaths.

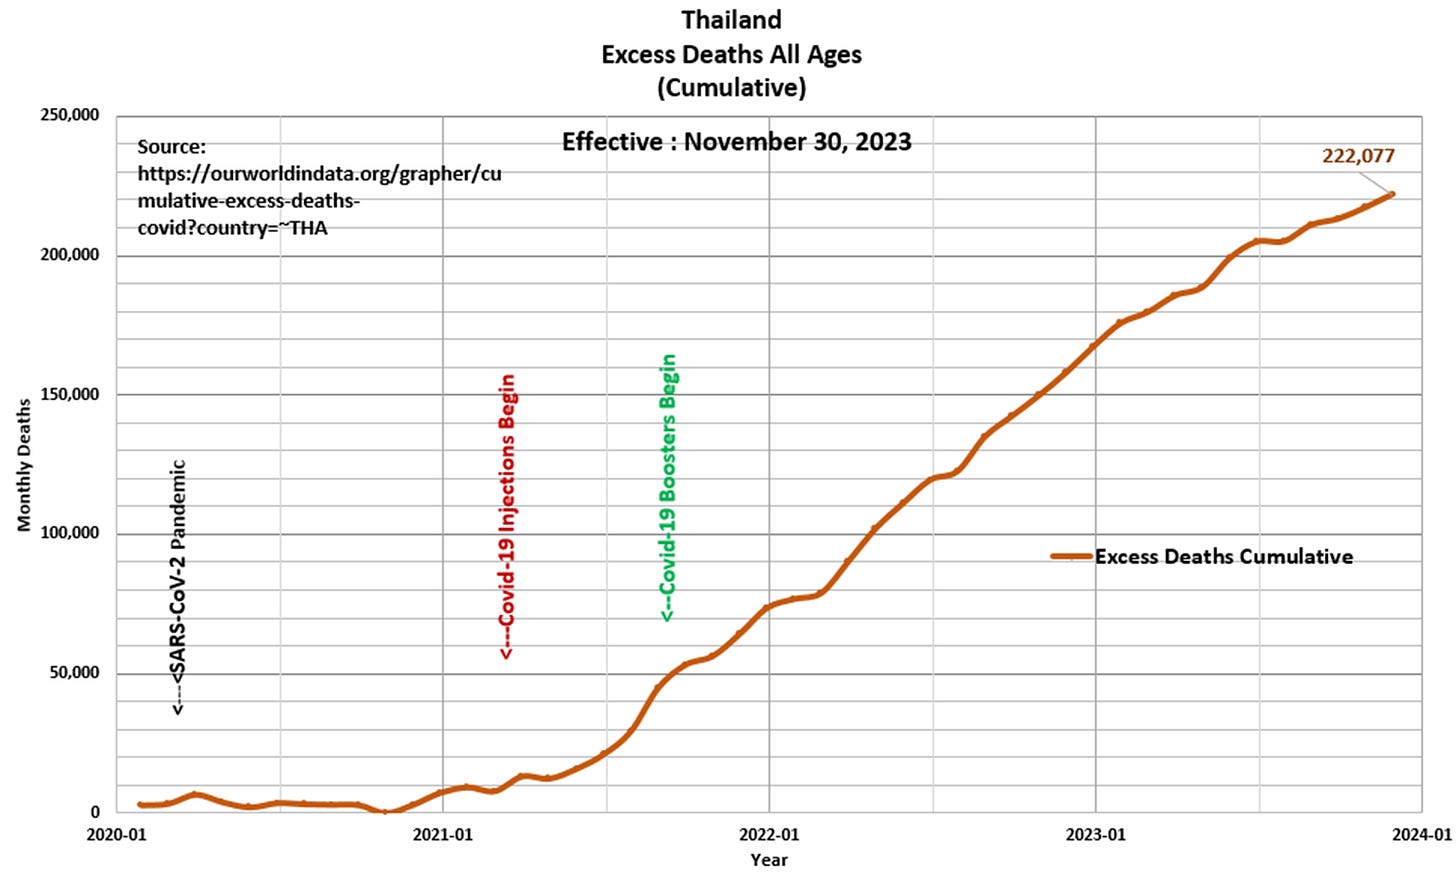
Panel 4 Based on the data and this author’s model, there have been 222,077 Excess Deaths since the start of the pandemic of which 209,000 (94 percent) have occurred since the start of Covid-19 injections in March 2021. This compares to 196,054 Excess Deaths since January 2020 as per the https://ourworldindata.org/grapher/cumulative-excess-deaths-covid?country=~THA website.

The devil whispers “You can’t withstand the storm”…the Warrior replied “I am the storm” Unknown author
Traditional warrior, Thailand


