by Eldric Vero
January 4, 2024
This CotD was inspired by two recent articles:
1) MercoPress South Atlantic News Agency “Uruguayan hospitals: Facemasks no longer mandatory” (see link: https://en.mercopress.com/2023/12/29/uruguayan-hospitals-facemasks-no-longer-mandatory ). From the article: “The widespread use of masks in hospital centers in recent times has only generated an unnecessary barrier in patient care, over-aggregated contamination, expenses to the institutions, loss of credibility in the masks, discomfort for health professionals who have already been using them for almost four years and all this without any additional benefit,” Medina wrote.
2) The Expose News “Let a Scientist Speak! Presentation Goes Viral ‘Because It’s True!’ ” (see link: https://expose-news.com/2024/01/01/let-a-scientist-speak-presentation-goes-viral-because-its-true/ ) . From the article: As a scientist, Rancourt states that after three years of intense study and looking at hard data, he has been able to conclude that there was “no pandemic”, “no evidence of a particularly virulent pathogen whatsoever” and there was “nothing that was spreading that was causing death.” From the video portion “the vaccines are a toxic substance……..we have studied more than a hundred countries now and the vaccines are clearly associated with peaks in all cause mortality….in more than half the countries in the world, there is no excess mortality until the vaccines are rolled out”.
The author of the CotD has combined analyses of Covid-19 and Excess Deaths (all causes) as these are related.
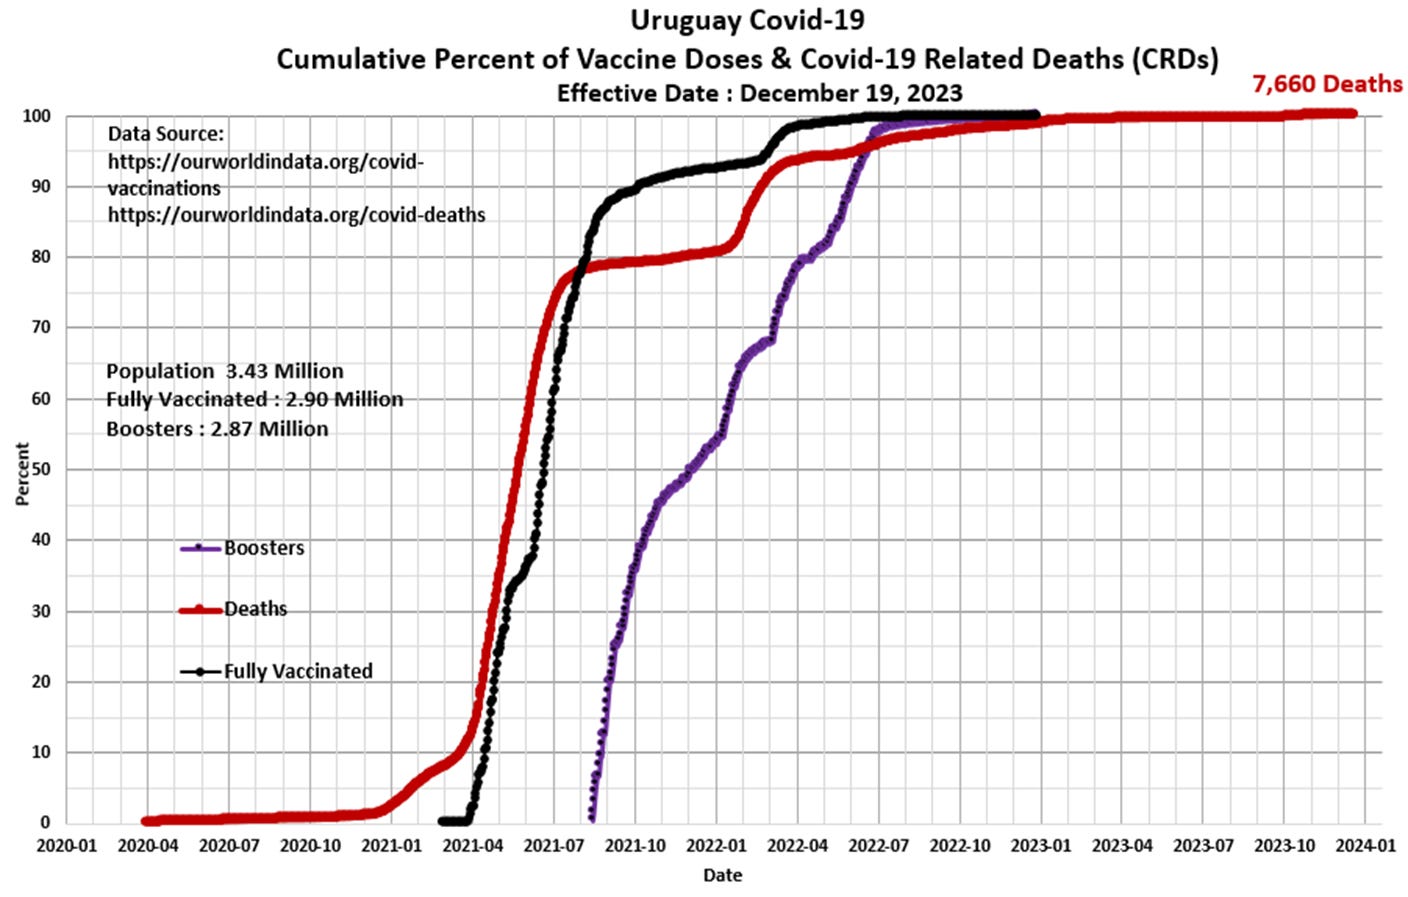
Panel 1 The first graph is a construct by the author as a standard CotD presentation which illustrates Covid-19 related deaths (CRDs) and vaccinations. Uruguay’s Covid-19 Related Death (CRD) rate was at a very low level from March 2020 to December 2020. The vaccination program started in February 2021 with injection uptake rates at warp speed into mid-year. Observe the startling near vertical rise of CRDs immediately after the injection program was initiated. The vaccine-to-deaths correlation of near 100 percent is clearly evident. The CRD rate peaked at 1,807 Uruguayan citizens dying over the 30 day period of April 11 to May 10, 2021 (i.e. over 60 deaths per day!). Note the vaccine data set in the ourworldindata.org website terminates ate the end of year 2022. The author could not find an official statement from the Uruguay Ministry of Public Health stating the vaccines are safe and effective.

Panel 2 Observe the characteristic cyclical nature of deaths or all-cause mortality since 2015. The “Blue” line represents data prior to March 2020 and the “Red” line represents data since the SARS CoV-2 pandemic was initiated in March 2020. The “Green” line represents the “Expected” deaths (CotD Model) based on historical averages. The author has utilized the data for the six year period January 2015 to December 2020 in order to calculate an average normalized curve for Monthly Deaths. The Expected (CotD Model) deaths incorporates an average 5 percent growth factor which sounds aggressive, however, this appears to be a good match to the overall trend.

Panel 3 This presents the magnified portion (January 2020 to June 2023) of the graph in Panel 2. The “Orange” line represents “Excess Deaths” which is calculated by subtracting Expected Deaths from Official Deaths.

Panel 4 Based on the data and this author’s model, there have been 10,292 Excess Deaths since the start of the pandemic of which 9,900 Excess Deaths (96.2 percent) have occurred since the start of Covid-19 injections in February 2021. This compares to 7,325 Excess Deaths since February 2021 as per the https://ourworldindata.org/grapher/cumulative-excess-deaths-covid?country=~URY website.

“Where no one intrudes, many can live in harmony” Chief Dan George
Monument to the Charrua indigenous people of Uruguay

Support Eldric Vero Substack


