(Opus the Penguin and Bill the Cat (created by Berkeley Breathed)
by Eldric Vero
November 15, 2023
This CotD presents the historical “Provisional weekly estimates of the number of deaths, expected number of deaths and excess mortality” in Canada. The data source is accessed via the Canada government website : https://www150.statcan.gc.ca/t1/tbl1/en/cv.action?pid=1310078401.
Panel 1 Observe the characteristic cyclical nature of deaths or all-cause mortality since 2010. The “Blue” line represents data prior to March 2020 and the “Orange” line represents data since the SARS CoV-2 pandemic was initiated in March 2020. The “Green” line represents the “Expected” deaths based on historical averages as per Statistics Canada.

Panel 2 This presents the magnified portion (January 2020 to September 2023) of the graph in Panel 1. The “Red” line represents “Excess Deaths” which is calculated by subtracting Expected Deaths from Official Deaths. Based on this data, 95,200 Excess Deaths have occurred March 2020 to September 2, 2023. It should be noted that since December 2020 (the start of Covid-19 injections) there have been 78,100 Excess Deaths which represents 82 percent of these deaths.

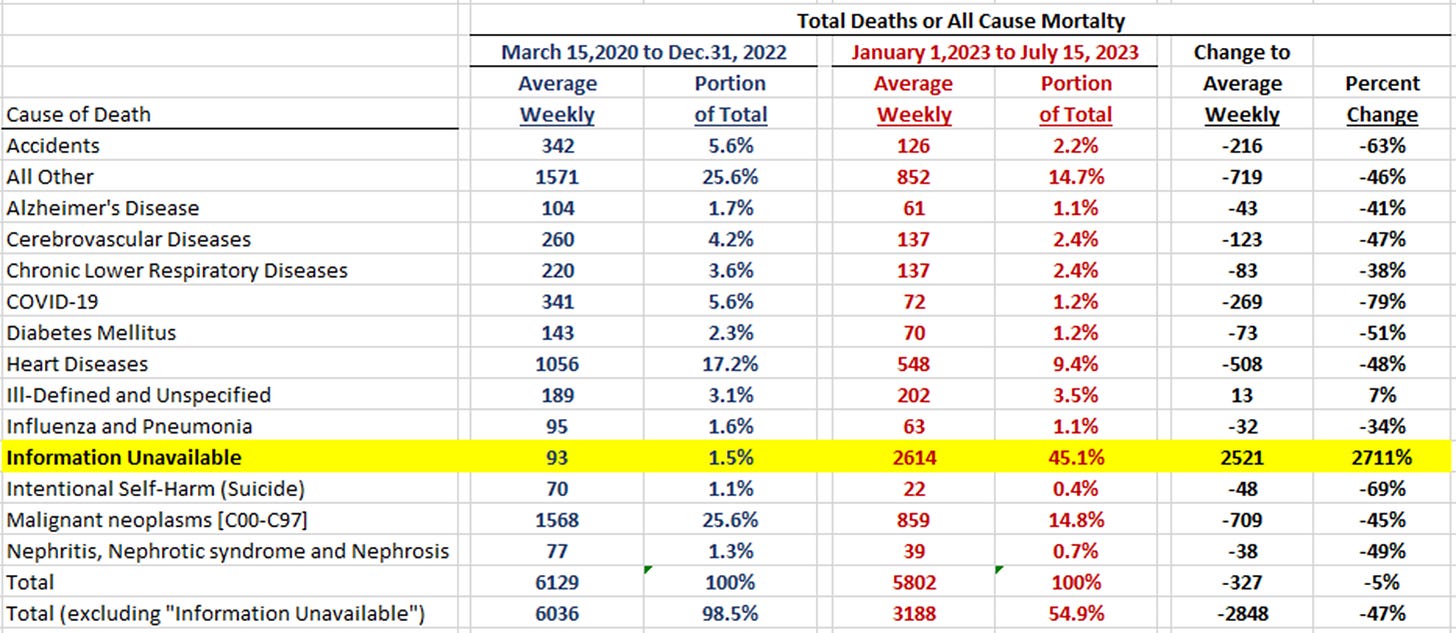
Panel 3 The following table presents the Cause of Death categories as per Statistics Canada : https://www150.statcan.gc.ca/t1/tbl1/en/cv.action?pid=1310081001. Utilizing data within the Statistics Canada website, a summary table was created depicting two recent periods for comparison purposes. The majority of the categories have been in the database for many years (since 2010) with the exception of two recent categories, namely, “COVID-19” and “Information Unavailable”. The “Information Unavailable” (InfoUn) category had no data (i.e. deaths) prior to January 1, 2020. For the period March 15, 2020 to December 31, 2022, the InfoUn category averaged about 93 deaths per week, which is unusual in itself, as medical doctors, examiners and coroners are required to define a Cause of Death. Note the eye-popping change to InfoUn deaths (2711 percent) as of January 1, 2023 from the previous period. Also note the negative Percent Change to essentially all of the categories to offset the massive positive change in InfoUn deaths. The question being is “why did this occur?”.

Panel 4 The following graph presents the data referred to in Panel 3. Is this a Statistics Canada database problem (for over 6 months) or something else?

Panel 5 The following graph presents the data related to the InfoUn Deaths referred to in Panel 3. This graphical data anomaly is well beyond statistical norms and must be investigated!


The protocols were murder and infectious clones are the only real threat