


by Eldric Vero
August 2, 2023
This is a presentation of two United States of America (USA) publicly traded markets: the S&P 500 stock market index (SPGSPC) and the S&P commodity index (SPGSCI).
The Standard and Poor’s 500, or simply the S&P 500, is a stock market index tracking the stock performance of 500 of the largest companies listed on stock exchanges in the United States. It is one of the most commonly followed equity indices. Total market capitalization of the S&P 500 companies is in the order of 33.8 trillion $US as of December 31, 2022 as per Wikipedia (https://en.wikipedia.org/wiki/S%26P_500).
The S&P GSCI (formerly the Goldman Sachs Commodity Index) serves as a benchmark for investment in the commodity markets and as a measure of commodity performance over time. The index currently comprises 24 commodities from all commodity sectors – energy products, industrial metals, agricultural products, livestock products and precious metals. The S&P GSCI is a world-production weighted index that is based on the average quantity of production of each commodity in the index, over the last five years of available data. This allows the S&P GSCI to be a measure of investment performance as well as serve as an economic indicator (see https://en.wikipedia.org/wiki/S%26P_GSCI).
Panel 1
This is a graph of the S&P 500 and the S&P GSCI indices since 1980. The return of the S&P 500 is essentially triple of the GSCI over the past 43 years. Note the GSCI has effectively traded flat since 2008 versus the S&P 500 which has increased by a factor of 5 times or about 11 percent per year. Amazing!

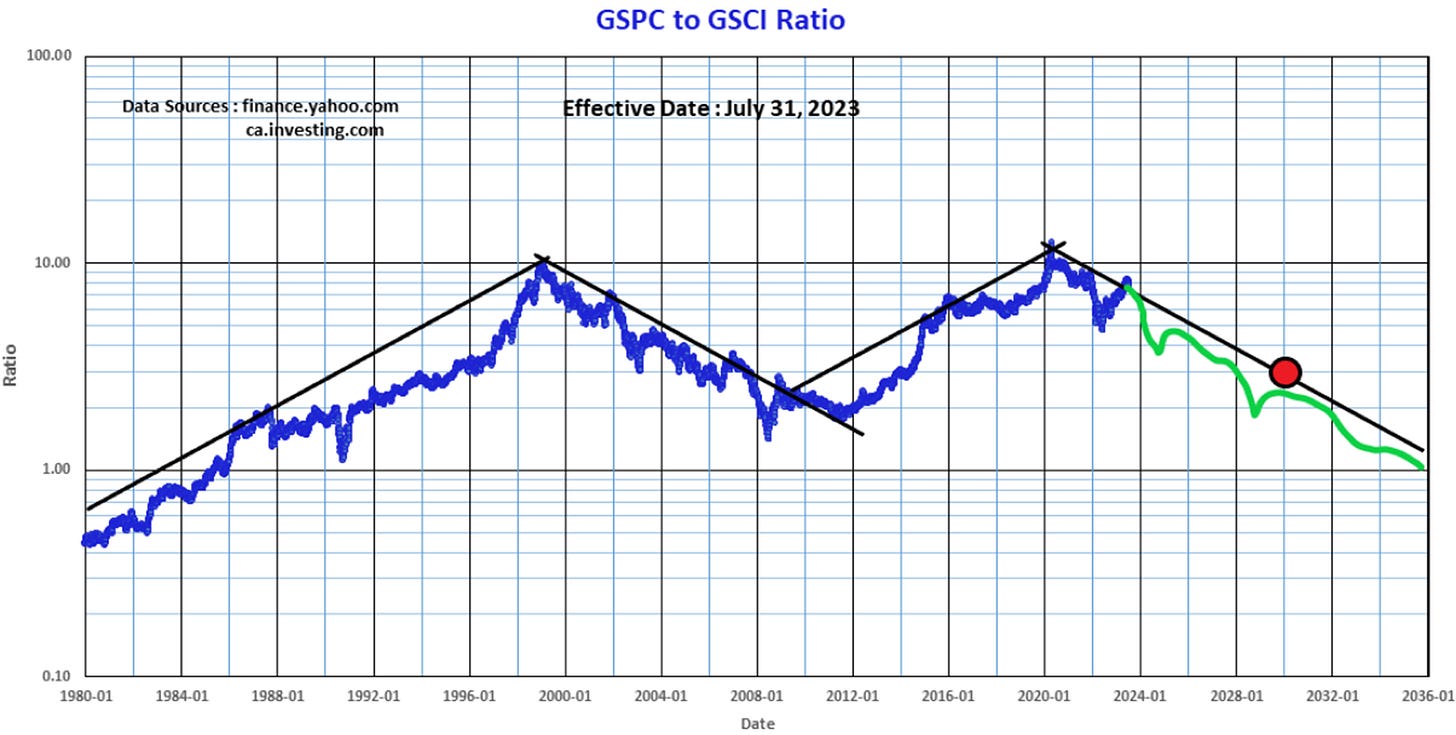
Panel 2
This graph presents a simple ratio of the S&P 500 index divided by the GSCI Commodity index. The ratio depicts the battle between the broad USA stock market index (in fiat dollars) versus real tangible value in commodities. Note the long-term cyclical nature and symmetry in this ratio with the slope of the “black lines” being equal mirror images. The author has drawn a “green line” as a potential forecast in the future path of this ratio. The large red dot represents a ratio of 3.0 by 2030 which has multiple implications to the entire stock market complex. For example, should the S&P 500 waffle in a relatively constant manner at 4,500 for the next 4 to 6 years, then the GSCI (the red line above) would soar to about 1,500 (2.5 times from current value). These are fascinating times and the pathway ahead is still unclear
