by Eldric Vero
June 25, 2023
This is a presentation of the Canada Pension Plan assets and liabilities as managed by the Canada Pension Plan Investment Board (CPPIB). The CPP was first established in 1966 and was essentially managed by the federal government from the beginning. The CPP is a “pay as you go” plan with contributions being the main source of the benefits. The federal government was conservative in the management of the CPP assets with the vast majority of investments in government bonds. In 1996, the federal government determined the CPP was unsustainable and required higher investment returns on a go-forward basis. In 1997, the CPPIB was created to build a diversified investment portfolio which allowed increased risk-taking in public and private markets. The data presented in this CotD is contained in the Actuarial Reports and Annual Reports on the CPPIB website cppinvestsments.com.
Panel 1
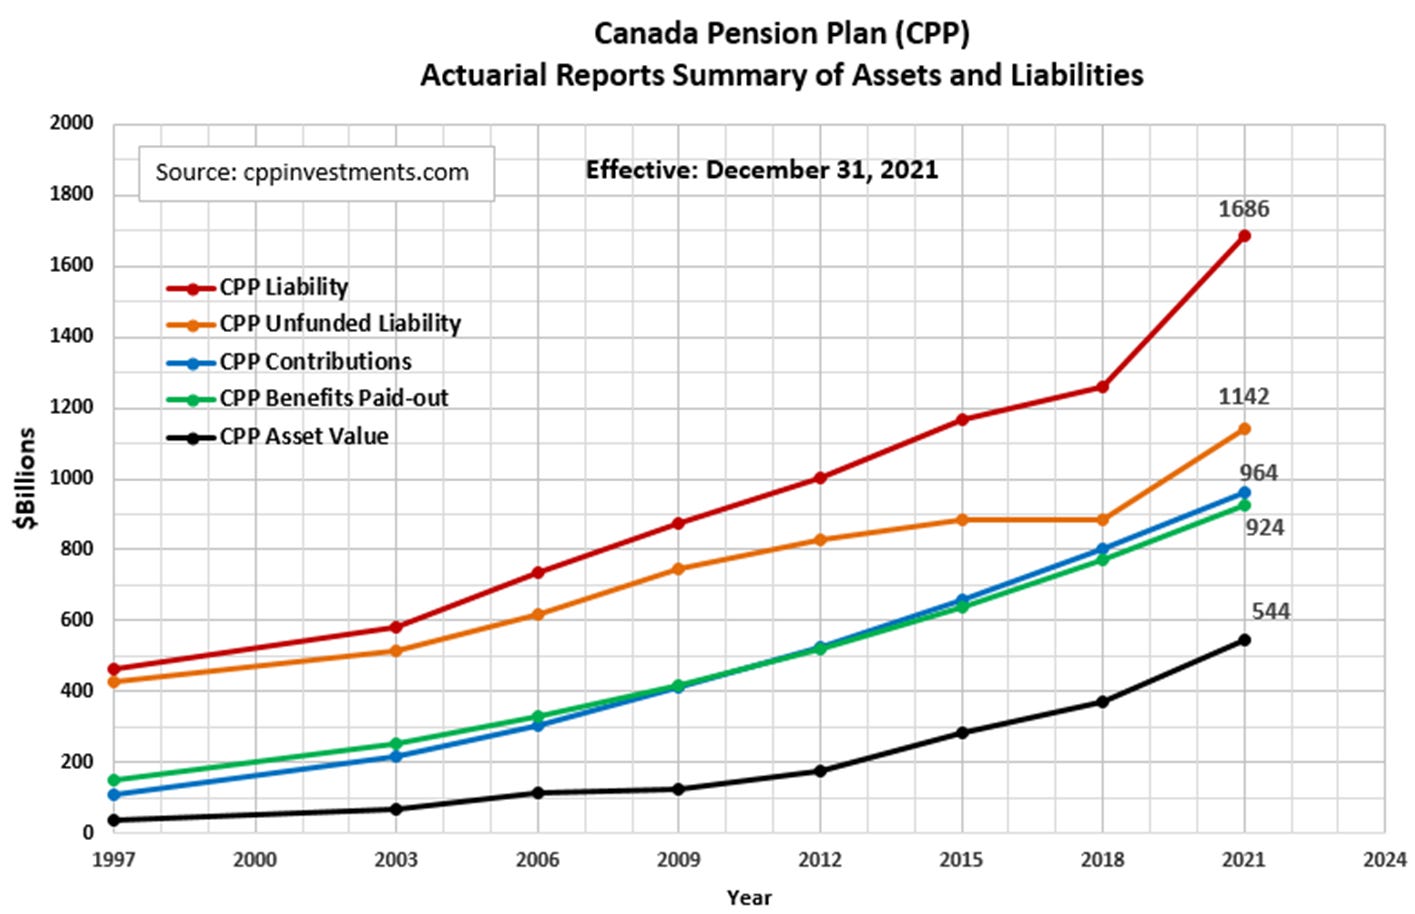
Actuarial Reports are issued every three years by the Chief Actuary from The Office of the Superintendent of Financial Institutions Canada. The purpose of the Actuarial Reports is for the financial state review by the federal Minister of Finance and the provincial Ministers of Finance. As per the December 31, 1997 Actuarial Report, the CPP Net Asset Value (NAV) was $37 Billion and at the time seemed like a large amount. However, the Liability side of the equation was enormous at $465 Billion, meaning the unfunded portion of the CPP was $428 Billion. Fast forward to the December 31, 2021 Actuarial Report which indicates the CPP NAV is $544 Billion, Liabilities are $1,686 Billion leaving the unfunded portion at $1,142 Billion. Simply put, the CPP Liability has increased $3.1 for every $1 gain in CPP NAV since 1997.

Panel 2
This is the graphical presentation of the Actuarial data in Panel 1. In addition, CPP Contributions and CPP Benefits paid-out are included to show the near balance of the “pay-as-you go” philosophy within the CPP. The Liabilities are out-pacing the Assets by a wide margin and have increased substantially since 2018.

Panel 3
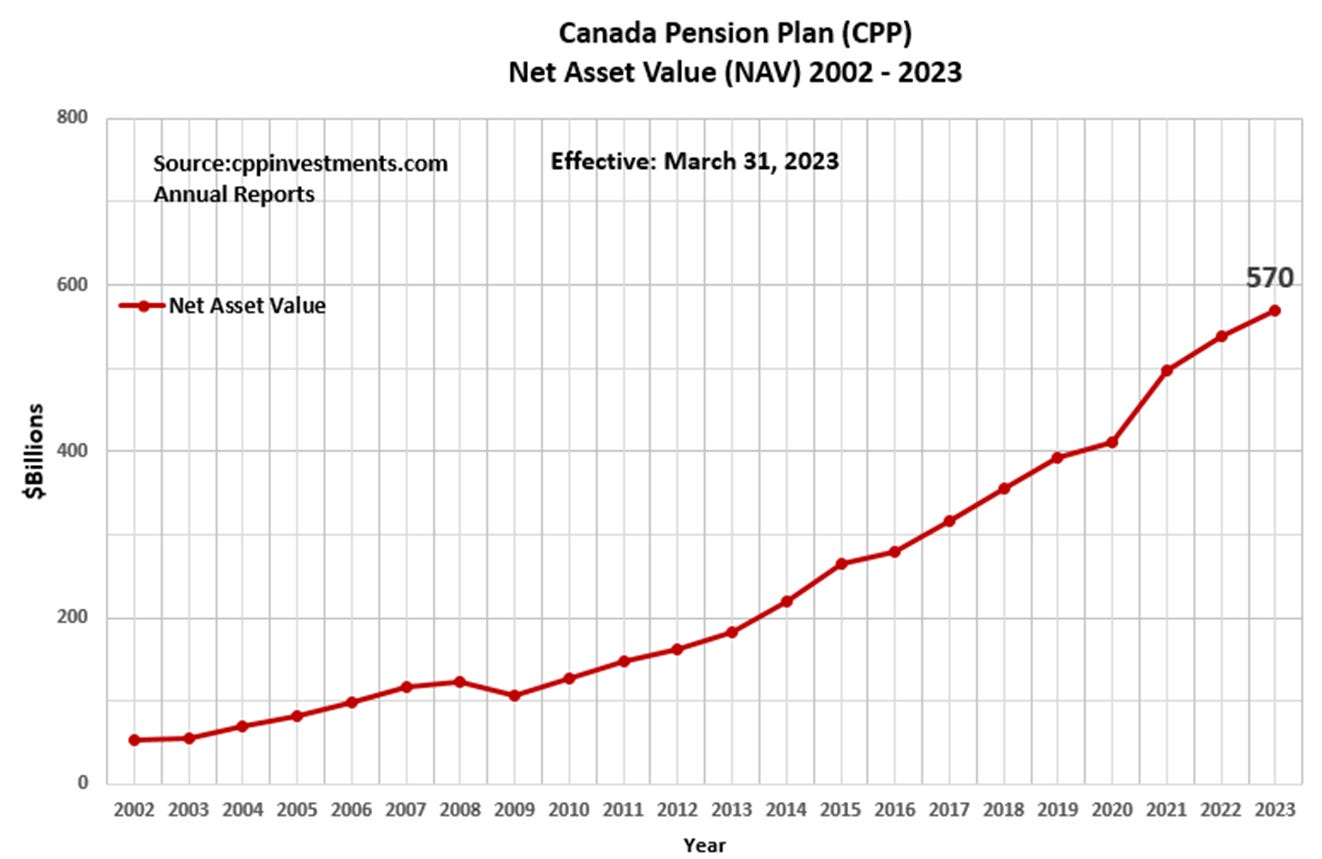
This is the historical CPP NAV extracted from the Annual Reports for the period 2002 to 2023 (see the Ten-Year Review table at the end of these Reports). Note the Annual Reports are effective March 31st of reporting year versus December 31st for the Actuarial reports. As of the most recent Annual Report effective March 31, 2023, the CPP NAV is $570 Billion.

Panel 4
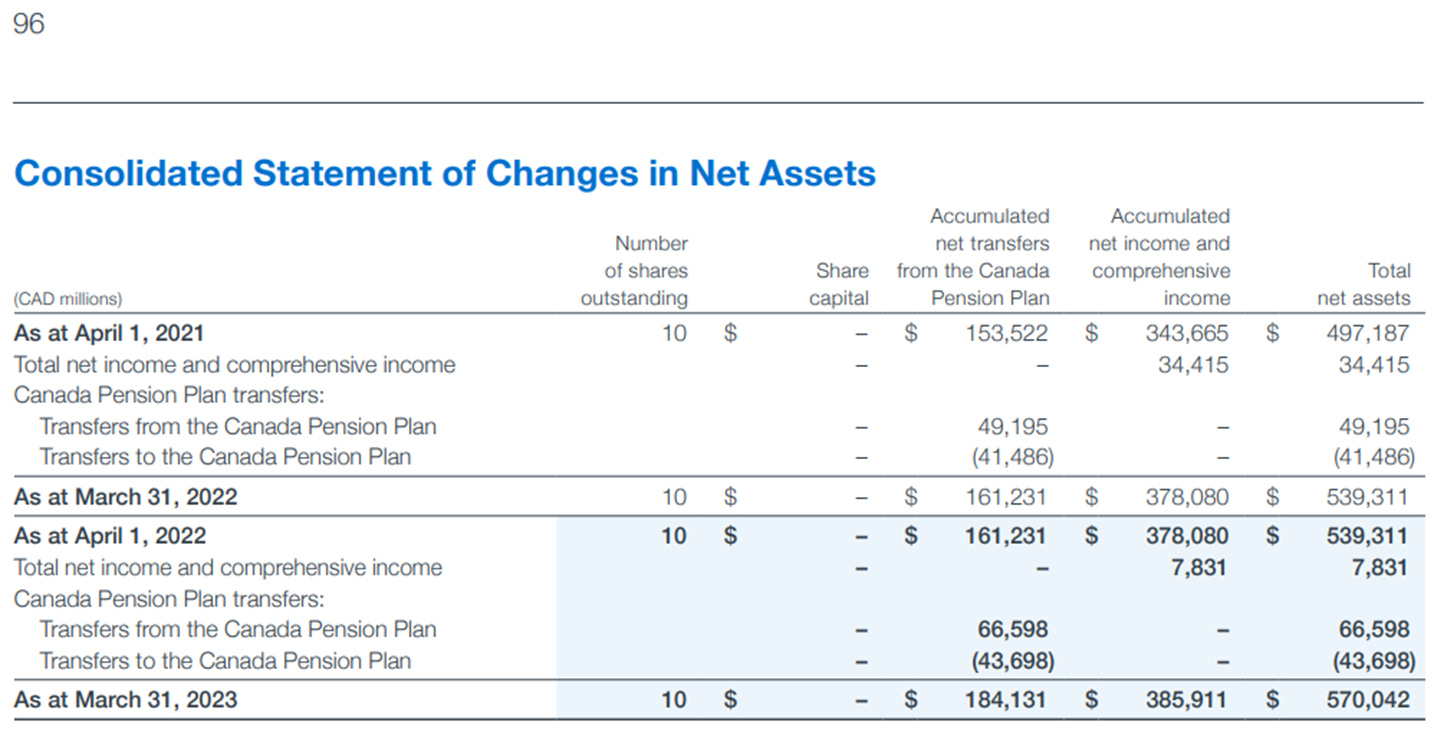
Page 96 of the 2023 Annual Report essentially summarizes the “make-up” of the $570 Billion as $184 Billion net transfers from the CPP and $386 Billion Income (via the various investments). So it appears approximately 33% are cash transfers from the CPP and 67% is CPPIB actual investment gains.

Panel 5
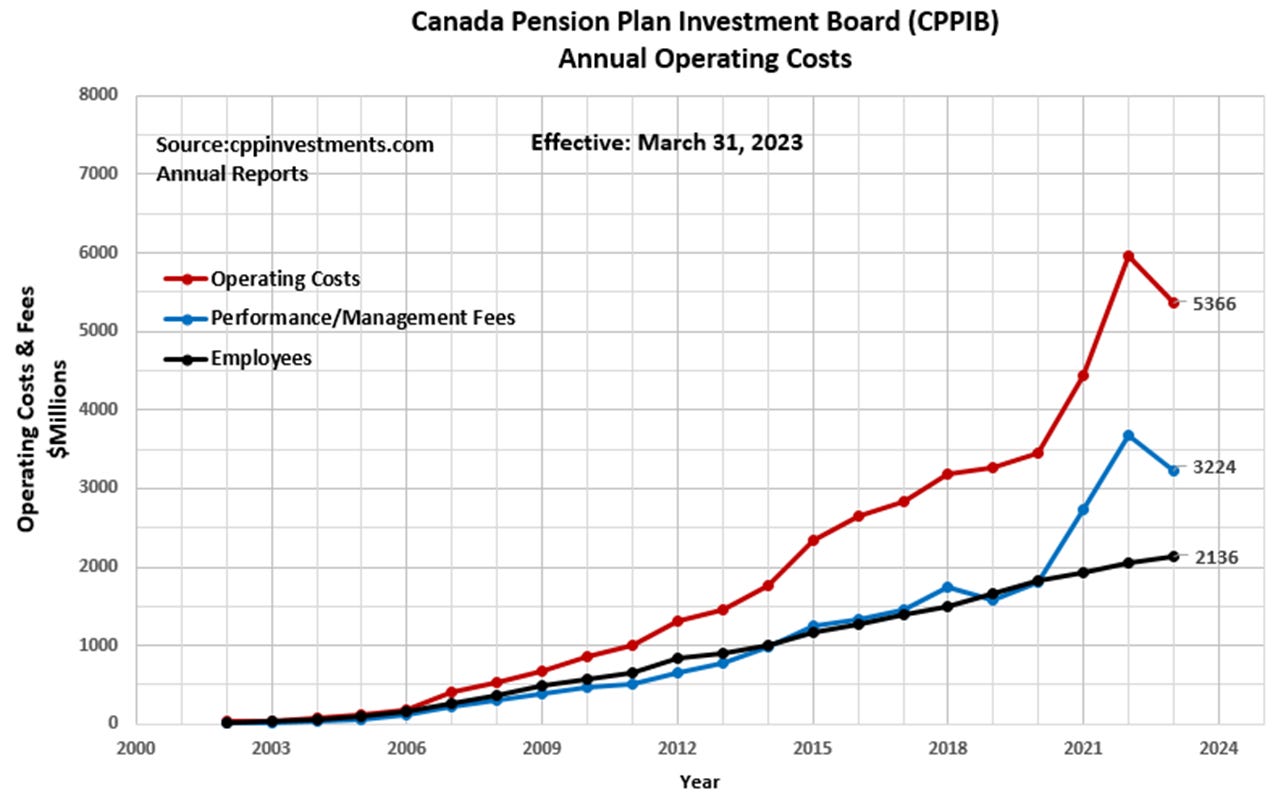
This presents the CPPIB historical annual operating costs for the past 21 years as per the Annual Reports. The CPPIB staff levels have increased from 26 to 2136 since the year 2002 (an 82-fold increase). Total operating costs have increased from $30 Million to $5.37 Billion (a 176-fold increase) over the same period. To put things in perspective, total operating costs are in the order of $2.6 Million per employee. Note the unusual increase in operating costs since 2020. One must ask the question “is the CPP sustainable under the current model?”.

As per the CPP Chairman of the Board Heather Monroe-Blum “In an era of uncertainty, Canadians can find confidence in a strong and stable CPP fund with benefits that will be there for them in retirement. Our organization was built for times like these”.
Do you agree with this statement?


Hell no I do not agree with this statement.